

Gold and stock markets hit new highs, how should we trade in this round of "bubble"?

The Federal Reserve's interest rate cuts have driven global asset prices up, leading the market into a bubble period driven by loose monetary policy. Gold, Bitcoin, and the stock market have seen significant gains this year, while the dollar and oil prices have declined. Bank of America strategist Hartnett proposed five trading strategies to cope with the bubble, including going long on core assets and investing in cheap value stocks. Goldman Sachs trader Schiavone pointed out that market sentiment has prompted capital to flow into risk assets. Despite frequent discussions about the bubble, historical data shows that there is still room for the current rise
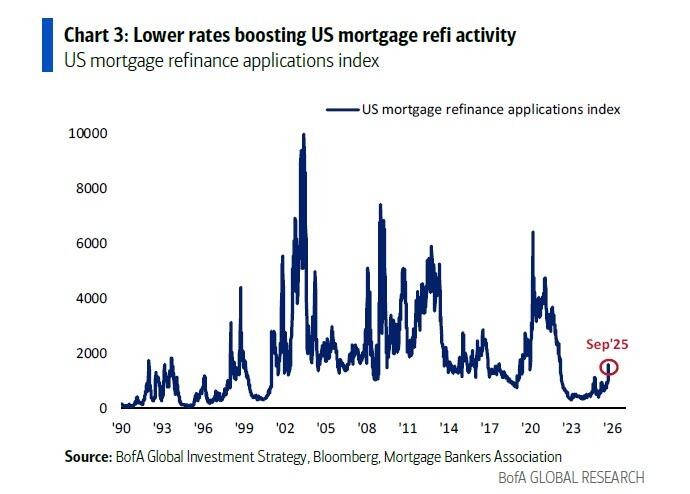
The Federal Reserve is moving to cut interest rates, and the prices of major global assets are soaring, as the market enters a bubble period driven by loose policies.
As of September 22, gold has risen by 35.4% this year, Bitcoin is up 17.2%, and global stock markets have increased by 14.3%. High-yield bonds and investment-grade bonds have also recorded substantial returns of 8.5% and 8.3%, respectively. In stark contrast, the U.S. dollar index and crude oil prices have fallen by 9.3% and 11.4%, respectively.
Bank of America strategist Michael Hartnett pointed out that tariff reductions, tax cuts, and interest rate cuts together create a "run-it-hot" policy environment, providing an implicit "too big to fail" guarantee for the economy and the stock market. Despite clear signs of a bubble, it may not have peaked yet. To respond to this market trend, Hartnett proposed five trading strategies, including: going long on core bubble assets; constructing a "barbell" portfolio by investing in cheap value stocks; shorting corporate bonds of bubble stocks; shorting U.S. bonds; and going long on bond volatility while shorting stock volatility.
Goldman Sachs trader Paolo Schiavone added from a market sentiment perspective, believing that there is a prevailing feeling in the market that "currency is depreciating, and holding is worse than consuming or investing," which is also driving funds into risk assets. This sentiment forces underperforming fund managers to chase high-risk, high-beta investment targets in order to keep up with market benchmarks before the year-end bonus season.
How much more room is there for this bubble?
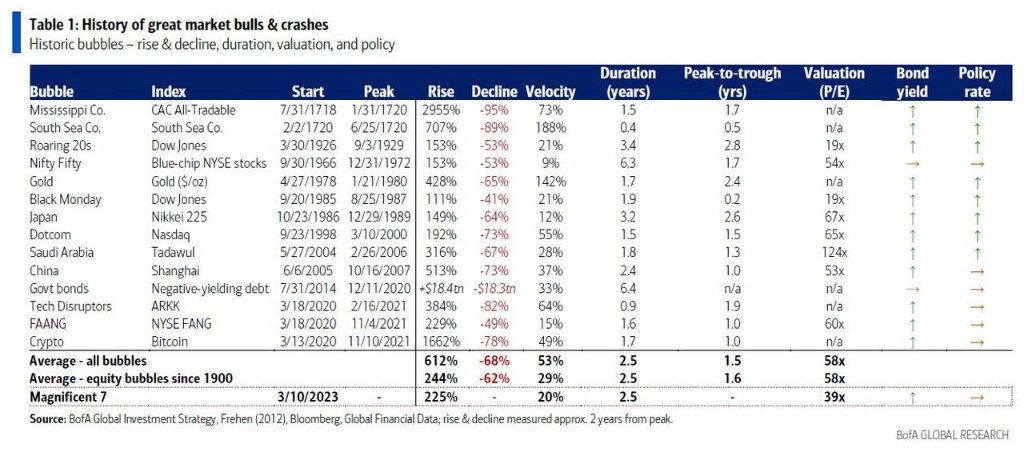
Despite the discussions about the bubble in the market, historical data suggests that the current rise may still have room to grow. Michael Hartnett analyzed 10 stock market bubbles since 1900, finding that the average increase from the low point to the peak was 244%, with an average dynamic price-to-earnings ratio at the bubble peak reaching 58 times, and stock indices being 29% above their 200-day moving average.
Using the "Seven Giants of Technology," which currently best represent the bubble, as a reference, they have risen 223% since their low in March 2023, with a dynamic price-to-earnings ratio of 39 times, and current prices are 20% above the 200-day moving average. Based on this, Hartnett judges that this bubble may "still have more room for growth." Historically, the average increase in the 14 bull markets in U.S. stocks over the past 100 years was 177%, lasting 59 months.
How to Navigate a Bubble Market?
In the face of a potentially still-expanding bubble, Hartnett has proposed a specific five-point trading strategy aimed at helping investors navigate the current market:
- Go Long on the Bubble Itself: Directly invest in the core assets of the bubble. However, it is important to note that the gains during bubble periods are often highly concentrated. For example, in the six months leading up to the peak of the tech bubble in 2000, the technology sector surged 61%, while all other sectors of the S&P 500 recorded declines.
- Build a "Barbell" Portfolio: Invest in bubble assets on one end and allocate to distressed cheap value stocks on the other. Asset bubbles can boost economic growth, thereby benefiting these undervalued value sectors. For instance, between October 1998 and March 2000, the only entity that outperformed the Nasdaq was Russia, which had just gone through a debt crisis. Currently, Brazil (P/E ratio of 9), the UK (P/E ratio of 13), and global energy stocks (P/E ratio of 13) can be seen as representatives of such cheap cyclical value stocks.
- Short the Corporate Bonds of Bubble Stocks: The credit market typically reflects the deterioration of a company's fundamentals earlier than the stock market. During the tech bubble, the prices of technology company bonds fell by 13% between October 1998 and March 2000, with credit spreads beginning to widen from June 1999.
- Short U.S. Bonds: Historical data shows that in the 14 asset bubbles over the past 300 years, 12 ultimately resulted in asset price inflation being transmitted to consumer price inflation, leading to policy rate hikes to burst the bubble. During this process, bond yields generally rise.
- Go Long on Bond Volatility, Short Stock Volatility: Rising stock markets typically suppress stock volatility indices like the VIX, but the upward trend in interest rates will increase volatility in the bond market.
Potential Risks and Overseas Opportunities
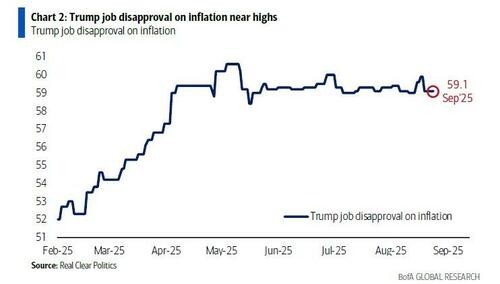
Despite optimistic market sentiment, risks still exist. A significant political risk is that Trump's job dissatisfaction regarding inflation issues is as high as 59%. The continued rise in asset prices may further transmit to consumer goods prices, triggering a second wave of inflation, which will bring immense political pressure before the midterm elections in 2026. Therefore, the U.S. government may continue or expand price interventions in industries that "stir up inflation" (such as large pharmaceuticals and major energy companies). Hartnett also warns that as electricity prices soar, "large utility companies are becoming the next most vulnerable sector."
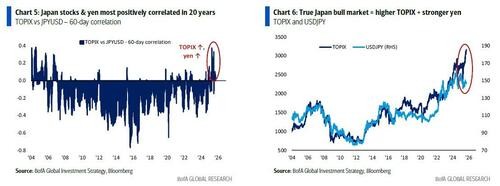
Meanwhile, the continued weakness of the dollar presents opportunities in international markets. Hartnett points out that "global rebalancing" is a new theme for the second half of the 2020s, and a bear market for the dollar is favorable for international stock markets. A noteworthy sign is that the yen has shown a positive correlation with the Japanese stock market for the first time in 20 years, **which is seen as a signal that Japan is entering a true bull market, with the yen strengthening in sync with the stock market rise ** For investors seeking diversified allocation, this may indicate that an opportunity window is opening.
Risk Warning and Disclaimer
The market carries risks, and investment should be approached with caution. This article does not constitute personal investment advice and does not take into account the specific investment objectives, financial situation, or needs of individual users. Users should consider whether any opinions, views, or conclusions in this article align with their specific circumstances. Investment based on this is at one's own risk
