

Gold, dividends, and growth all rise together. How to understand this abnormal phenomenon?

In this year's strong market environment, the phenomenon of gold, dividends, and growth stocks rising together has attracted attention. Typically, these three types of assets have different pricing logic: gold reflects safe-haven value, dividends perform well in deflationary environments, while growth stocks perform well in inflationary conditions and when risk appetite is high. However, this year's market performance has broken this convention, showing a simultaneous rise of deflationary and inflationary assets, suggesting that traditional asset pricing frameworks may be failing
In this year's overall strong market environment, there are some perplexing aspects, such as the simultaneous rise of risk assets (growth stocks in the US, Hong Kong, and A-shares) and safe-haven assets (gold), as well as the simultaneous rise of deflationary (dividends) and inflationary (gold) assets. Normally, the underlying pricing logic for these three different types of assets—gold, dividends, and growth—varies: gold reflects more of a safe-haven and store of value, dividends outperform in deflationary or defensive environments, while growth corresponds to inflation and improved risk appetite. However, looking back at this year, from January to March, gold and growth rose together; from April to July, dividends and growth rose together; and from July to September, gold and growth rose together, which seems illogical.
Chart 1: Year-to-date performance of gold and growth outperforming broad indices
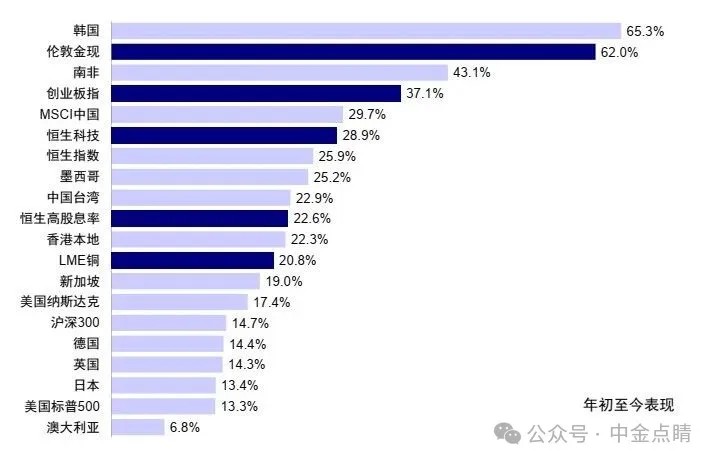
Note: Data as of October 17, 2025
Source: FactSet, CICC Research Department
Chart 2: From January to March, gold and growth rose together; from April to July, dividends and growth rose together; from July to September, gold and growth rose together
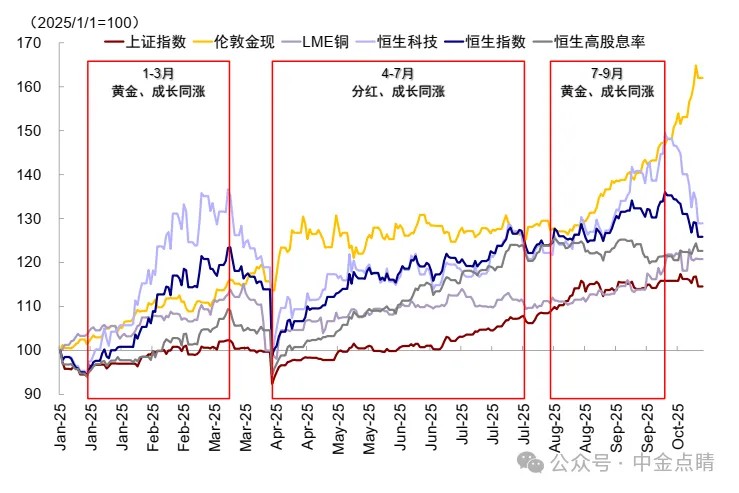
Source: Wind, CICC Research Department
How can we understand this "anomalous" phenomenon? Has the asset pricing framework of deflation and inflation cycles failed? If so, what factors are more important in pricing? Moreover, in an environment where the cycles of China and the US are still misaligned but both are approaching turning points (as discussed in "The China-US Credit Cycle May Face a Turning Point Again"), which types of assets or industries will present greater opportunities?
Behind the simultaneous rise of gold, dividends, and growth: Has the traditional "inflation and deflation" framework failed?
From a pricing theory perspective, the value of any asset should equal the total present value of its future cash flows. In other words, asset prices are determined by all future cash flows it can generate and the discount rate (risk-free rate + risk premium). From a cash flow perspective, gold, dividends, and growth represent three distinctly different types of assets: 1) Gold is the most unique, as it has no cash flow and even negative cash flow (with storage costs), thus benefiting the most during inflation, especially hyperinflation; 2) Dividends or similar assets like bonds provide more near-term and stable cash flows, making them more attractive in low-growth and deflationary environments; 3) Growth has more long-term cash flows, thus outperforming in growth and moderate inflation. Therefore, if we only consider these three types of assets and roughly categorize them according to inflation and deflation environments, the ranking in a deflationary environment would be: dividends > gold > growth; while in an inflationary environment, the ranking would be: growth > gold > dividends.
Clearly, the performance this year cannot be simply summarized using the traditional inflation and deflation framework. This is not because it has failed, but because other factors have played a dominant role during this phase. Exploring the underlying reasons is crucial for our judgment of future trends First of all, asset rotation cannot be simply explained by a single logic of "inflation" or "deflation." Many other variables also play a role, such as the demand for gold purchases by central banks under the fragmented global geopolitical landscape, the rising geopolitical risks, and the more long-term restructuring of the global monetary system. These factors go beyond the basic logic of simple deflation and inflation, which is both a major driver of gold's rise this year and the reason why gold prices have "diverged" from the framework of the dollar and real interest rates. Our calculations show that when the gold price exceeds $5,500 per ounce, the total value of gold in stock will exceed the $38 trillion of U.S. Treasury bonds in stock.
Chart 3: Gold price "diverges" from the dollar and real interest rate framework
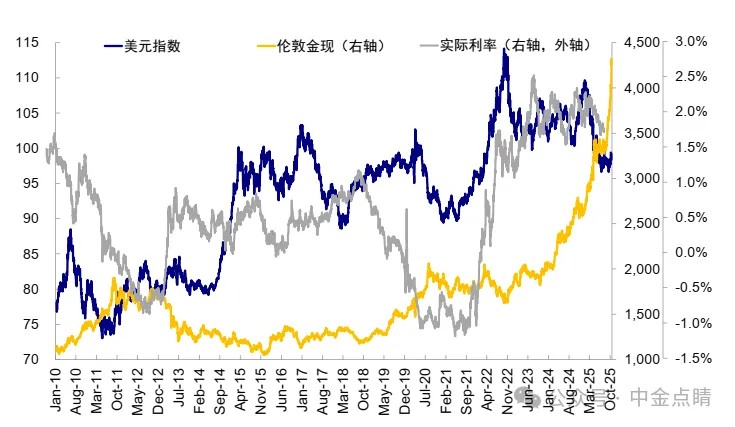
Source: Wind, China International Capital Corporation Research Department
Chart 4: When the gold price exceeds $5,500 per ounce, the total value of gold in stock will exceed the $38 trillion of U.S. Treasury bonds in stock
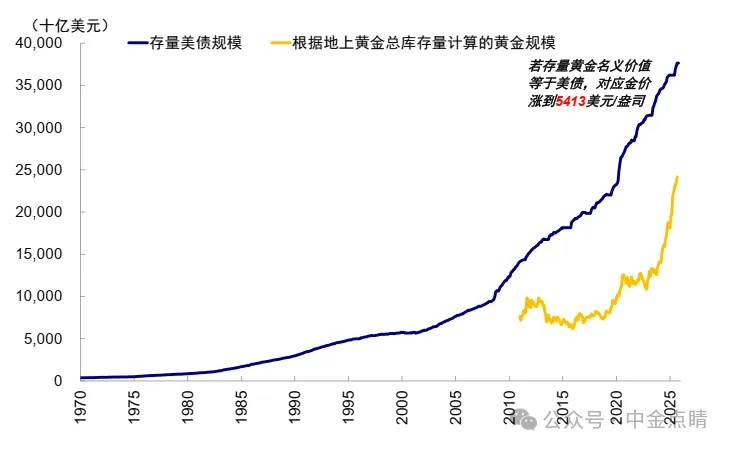
Source: Haver, China International Capital Corporation Research Department
Secondly, the current macro environment cannot be simply summarized as inflation or deflation. For China, although the overall economy and apparent prices, especially PPI, are still in a downward range due to the impact of real estate and upstream resource products, the excess liquidity leads to a price increase for any "scarce" asset that has returns or even return expectations due to a large influx of funds, presenting a localized inflation phenomenon. The previous government bonds and dividends, as well as the current gold and technology innovation, all reflect relative inflation (i.e., relative purchasing power decline). Even in the CPI components, this coexistence of deflation and inflation is evident. Therefore, more accurately, the current situation in China should be seen as excess liquidity and localized inflation hidden under the overall price decline, which explains why both dividends and growth are rising; essentially, it is the pursuit of liquidity for scarce returns.
In contrast, the U.S. does not face the stagflation that the market fears, but rather a technological trend under stagflation concerns, which allows for the simultaneous rise of technology stocks and gold.
Chart 5: China's inflation is declining but internally differentiated
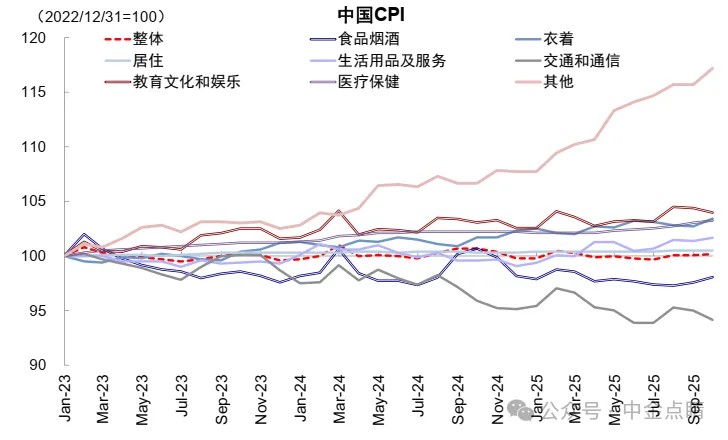
Note: Data as of October 17, 2025
Source: Wind, FactSet, China International Capital Corporation Research Department
Finally, the cyclical misalignment between China and the U.S. and the interaction of technological trends will also affect asset performance. For example, U.S. technology may reflect on China's technology chain, and gold will also be influenced by the U.S. inflation environment and dollar pricing under the cyclical misalignment between China and the U.S Chart 6: The Interaction of Sino-U.S. Technology Trends Affects Asset Performance
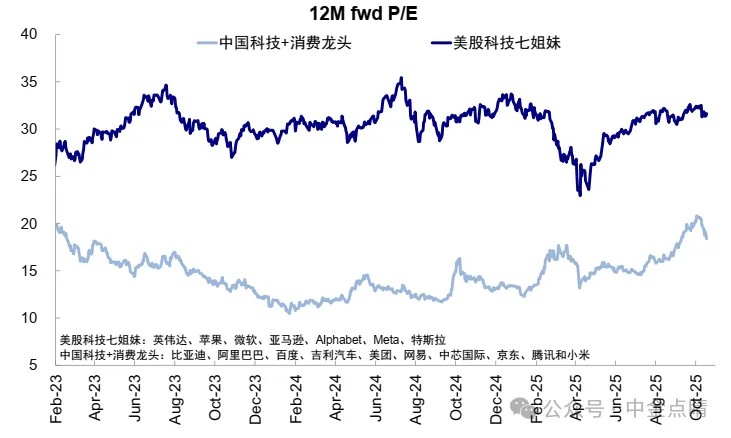
Source: Wind, FactSet, CICC Research Department
Therefore, a single focus on inflation or deflation cannot fully grasp the asset rotation patterns in the Chinese market, but directly resorting to "agnosticism" is not a solution either. Currently, external tariff challenges are increasing, and internal economic growth is slowing, with the market accumulating considerable floating profits in terms of structural prosperity. How should we allocate assets, and which assets will benefit more? We believe that the credit cycle framework is an effective solution, which is also the approach we have been using over the past few years in "The Sino-U.S. Credit Cycle May Welcome a Turning Point Again."
How to Grasp the Rotation Patterns of Chinese Assets? Start from the Causes and Use the Credit Cycle as a Tool
Whether using the traditional deflation and inflation framework or the more classic Merrill Lynch clock, similar "pain points" will be encountered in specific applications: on one hand, inflation and deflation are ultimately results that do not consider the causes and other influencing factors; on the other hand, in China, the "incompatibility" may arise due to different policy environments. For example, the traditional Merrill Lynch clock suggests that cash outperforms during stagflation because it considers that central bank tightening harms gold, but from the perspective of inflation itself, inflation harms the purchasing power of cash, making gold more beneficial.
Chart 7: The Merrill Lynch Clock May Be "Incompatible" in China Due to Different Policy Environments
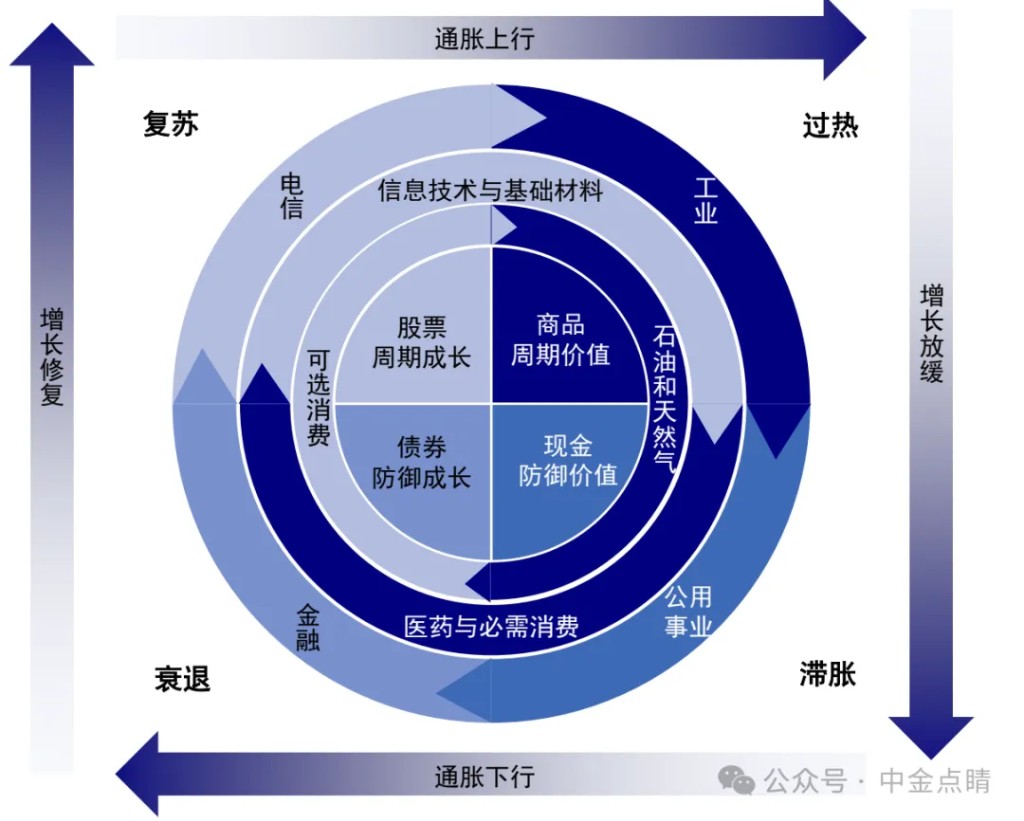
Source: Bank of America Merrill Lynch, CICC Research Department
We believe that an alternative approach to solving this problem is to start from the causes and use the credit cycle as a tool. Inflation and deflation are the results and phenomena of the combined effects of various factors such as the economy and policy. If we start directly from the causes of these economic phenomena, we may achieve different or even better results. This is also the main intention of the credit cycle framework: deflation and inflation are the results of demand strength and weakness, and the essence of demand comes from credit expansion.
The main bodies of credit expansion can be divided into government sectors and private sectors, which can further be divided into three main components based on determining factors: first, new industrial trends represented by AI; second, government-led fiscal stimulus; and third, traditional demand from the private sector represented by real estate consumption and traditional manufacturing. Among these three components, except for government spending, the other two essentially depend on the gap between their respective investment returns and financing costs, such as the rental return rate of real estate and the mortgage interest rate for residents.
Chart 8: The Determining Mechanism of the Credit Cycle is Divided into Three Parts: Fiscal, Traditional Demand from the Private Sector, and Emerging Investments Driven by Technological Industry Trends
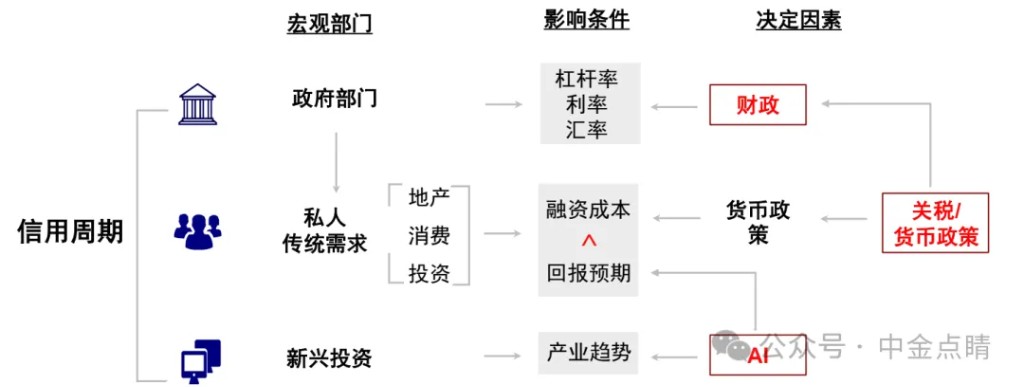 Source: China International Capital Corporation Research Department
Due to the greater influence of policy guidance on market expectations in China and the higher proportion of indirect financing, analyzing the asset rotation patterns in China can use the credit cycle as a focal point, characterized by the following two indicators: 1) General fiscal deficit pulse: measures government credit expansion, calculated by the year-on-year change in the general fiscal deficit as a proportion of GDP, compensating for the contraction of private sector credit; 2) Private sector social financing pulse: measures private credit expansion, calculated by the year-on-year change in new social financing in the private sector as a proportion of GDP, reflecting the demand for real financing and the intensity of credit issuance.
In most cases, the general fiscal deficit and private sector social financing pulses do not move in sync, as they originate from different starting points. Private sector financing mainly reflects spontaneous economic demand, while government finance inherently has a counter-cyclical adjustment function. When the economy is in decline, the government increases fiscal support, while it moderates during economic overheating, so the general fiscal deficit pulse and private sector social financing pulse often offset each other. At certain stages, due to the speed of policy response, they may also move up or down simultaneously. Therefore, we need to observe the overall trend and also break it down to see who is driving it, to judge the different implications for asset performance.
Chart 9: Observing changes in general fiscal deficit and private social financing pulses using the credit cycle as a focal point
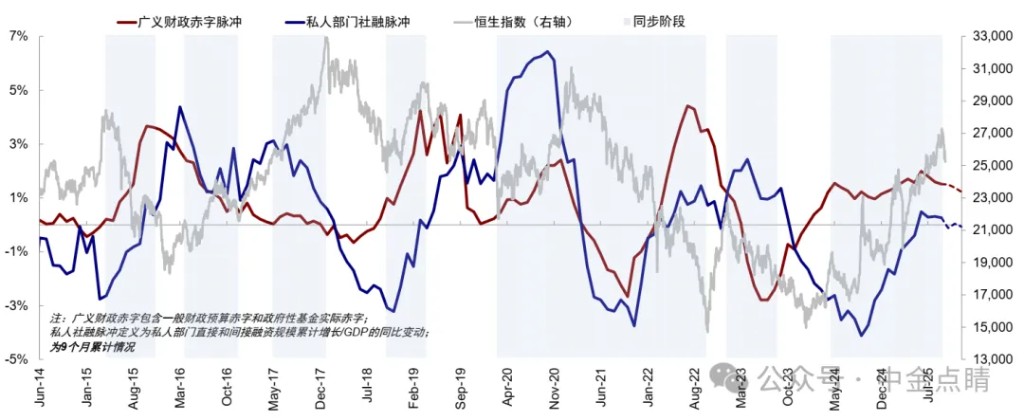
Source: Wind, China International Capital Corporation Research Department
Practical effects of the credit cycle in asset rotation: "Strong fiscal + strong social financing" leads to stronger commodity growth, "Weak fiscal + weak social financing" puts pressure on the stock market and commodities
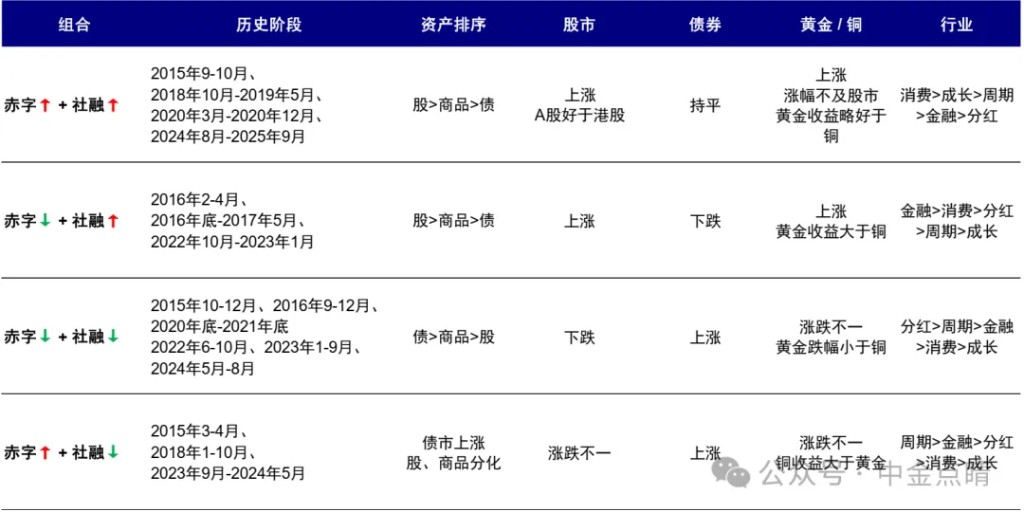
So, how effective is the credit cycle framework in judging asset rotation? We divide the different combinations of fiscal and private credit pulses into four stages: "Strong fiscal + strong social financing," "Weak fiscal + strong social financing," "Weak fiscal + weak social financing," and "Strong fiscal + weak social financing." By reviewing the asset and industry performance in different stages over the past decade, we find relatively stable rotation patterns.
Chart 10: Risk assets outperform during credit expansion phases, while bonds and dividends benefit during credit contraction phases
Source: Wind, China International Capital Corporation Research Department
For example, since September 24 last year, both the fiscal pulse and private social financing pulse have risen, entering the "Strong fiscal + strong social financing" phase, leading to an overall strengthening of risk assets. However, looking ahead, as the high base effect becomes apparent and the pace of fiscal efforts slows, the credit cycle may gradually move towards the "Strong fiscal + weak social financing" or "Weak fiscal + weak social financing" phases (depending on the pace of fiscal efforts) (《The China-U.S. Credit Cycle May Face a Turning Point Again》).
Strong fiscal + strong social financing (such as since September 24 last year): stock market > commodities (gold slightly better than copper) > bond market. The most typical phase is from September 24 last year to now, where the fiscal deficit and private social financing pulses have risen simultaneously, increasing market risk appetite In addition, the periods from September to October 2015, October 2018 to May 2019, March 2020 to December 2020, and August 2024 to September 2025 also belong to this stage. Due to the synchronous recovery of the credit cycle, based on the median annualized returns, the stock market > commodities (gold slightly better than copper) > bond market, with a 70% probability of stock market gains. The median annualized return of A-shares is 59%, outperforming Hong Kong stocks by 43%, while bonds lag behind. In terms of sectors, consumption > growth > cyclical > financial > dividends.
Weak fiscal + strong social financing (such as from October 2022 to January 2023): stock market > commodities (gold better than copper) > bond market, but the probability of stock market gains decreases. This stage includes February to April 2016, late 2016 to May 2017, and October 2022 to January 2023. Under the combination of "weak fiscal, strong social financing," policy support weakens but real demand continues to improve, transitioning the economy from "policy-driven" to "endogenous recovery." The stock market benefits from improved corporate profit expectations, commodities benefit from capital flowing to the real economy, and the bond market weakens. However, in the absence of clear policy support, the intensity of private credit expansion will affect the performance of risk assets. During this stage, the median annualized return of A-shares is 21%, but the probability of gains is only 50%, with Hong Kong stocks outperforming A-shares. In terms of sectors, financial > consumption > dividends > cyclical > growth.
Weak fiscal + weak social financing (such as from January to September 2023): bond market > commodities (gold declines less than copper) > stock market. The periods from October to December 2015, September to December 2016, end of 2020 to end of 2021, June to October 2022, January to September 2023, and May to August 2024 all exhibit "weak fiscal and social financing." The decline in fiscal deficit pulses indicates weakened policy support, while the decline in private social financing pulses reflects weak demand from enterprises and households, leading to decreased risk appetite during the credit contraction phase. The bond market rises, with a median annualized return of 5%, significantly outperforming the negative returns of the stock market and commodities. In terms of sectors, dividends > cyclical > financial > consumption > growth.
Strong fiscal + weak social financing (such as from September 2023 to May 2024): bond market > commodities (copper better than gold) > stock market, with a 100% probability of bond market gains, while stock market performance depends on fiscal strength. Specific stages include March to April 2015, January to October 2018, and September 2023 to May 2024. Fiscal expansion occurs, but credit transmission is obstructed, and the private sector's willingness to finance is insufficient. At this time, the probability of stock market gains is 50%, with a median annualized return of -4% for A-shares, while Hong Kong stocks outperform A-shares. The bond market strengthens, with a 100% probability of gains and a median annualized return exceeding 6%. In terms of sectors, cyclical > financial > dividends > consumption > growth.
Of course, due to the complexity of the real environment, the above four stages cannot "perfectly" encompass all time periods, and there will be "divergences." However, the apparent divergences are influenced by significant external disturbances, so they cannot be considered as a disruption to the credit cycle framework For example,
-
Since last year’s credit expansion phase in 924, gold has surged significantly, even surpassing the stock market, which is a result of the "de-dollarization" narrative and rising risk aversion. However, it has not exceeded growth stocks, so from another perspective, it is not considered a divergence; the sharp rise in copper prices after the pandemic in 2020 benefited from the recovery in demand post-COVID-19 and ample liquidity. In some credit contraction phases, the decline in gold and copper is mostly due to external factors such as rising U.S. Treasury yields and tightening global liquidity, including periods like Q4 2015, Q4 2016, and the second half of 2022.
-
The phases where the credit cycle diverges from the stock market also have significant external disturbances. For example, in the second half of 2015, fiscal deficits and private social financing surged, but the stock market fell, mainly due to the overheating of sentiment caused by significant leverage in the secondary market since 2014, which led to a rapid rise in the stock market, followed by a deleveraging that caused a sharp decline; from April to September 2016, fiscal deficits and private social financing declined, but the stock market rose, mainly benefiting from the clear support provided by supply-side structural reforms.
Chart 11: Asset performance under different combinations of broad fiscal deficits and private sector social financing over the past decade
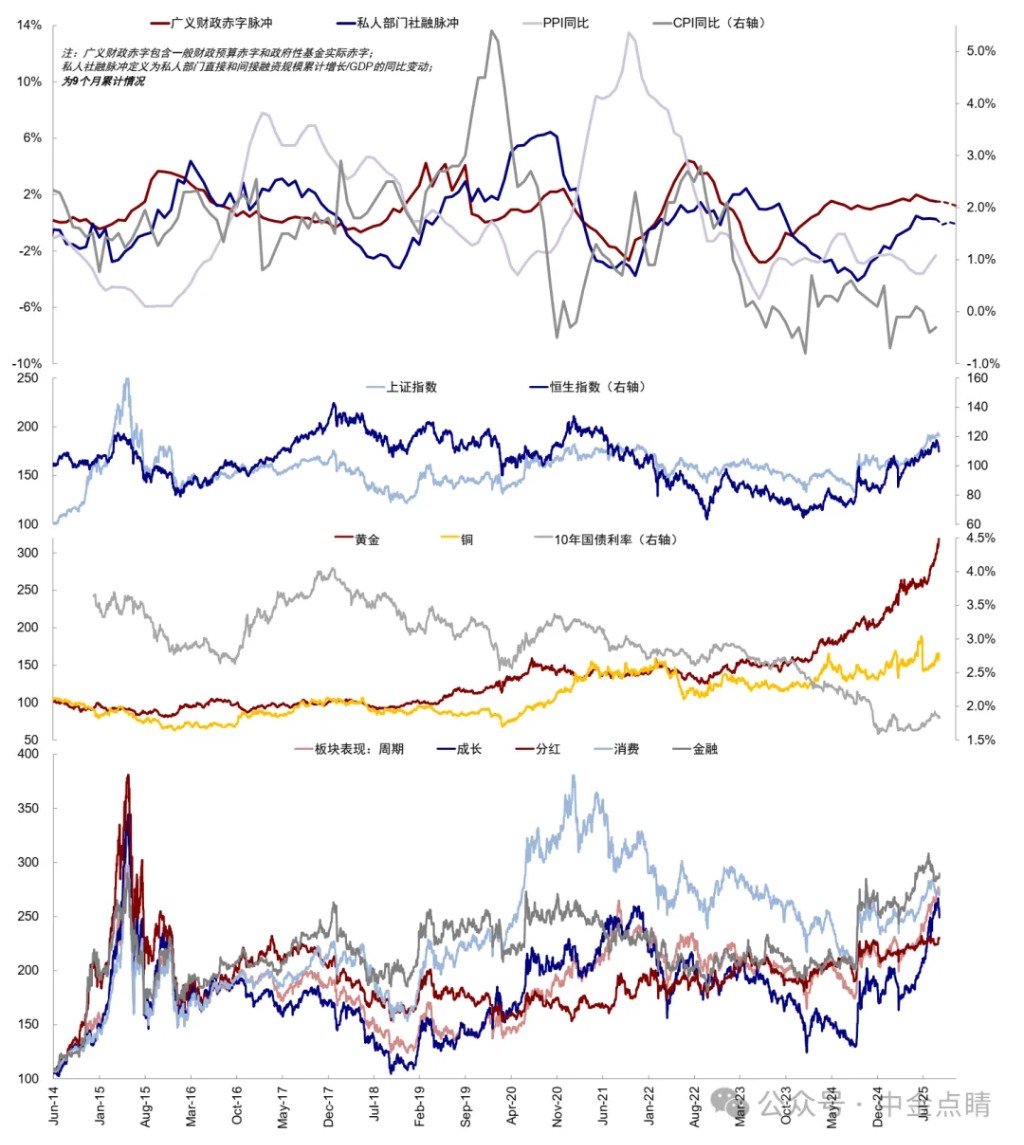
Source: Wind, CICC Research Department
Outlook: The credit cycle may shift to "strong fiscal + weak social financing" or "weak fiscal + weak social financing," focusing on the still-expanding economic structure
Looking ahead, based on our analysis in ("The Sino-U.S. Credit Cycle May Face a Turning Point Again"), due to the high base effect in Q4 last year, coupled with the fact that the private credit cycle has not effectively recovered and the pace of fiscal stimulus has slowed, China's credit cycle is likely to experience fluctuations or even weaken, transitioning from a combination of "strong fiscal + strong social financing" or "strong fiscal + weak social financing" or "weak fiscal + weak social financing" (depending on the speed of policy implementation). In fact, the data from September has already validated this, with the broad fiscal deficit pulse weakening from 1.59% to 1.52%, and the private social financing pulse declining from 0.31% to 0.26% (new credit in September was 1.3 trillion yuan, a year-on-year decrease of 300 billion yuan, with corporate medium- and long-term loans decreasing year-on-year for the third consecutive month, and household loans decreasing year-on-year by 111 billion yuan), all showing signs of turning downward.
Chart 12: Fiscal deficit and private social financing pulse fluctuating and weakening
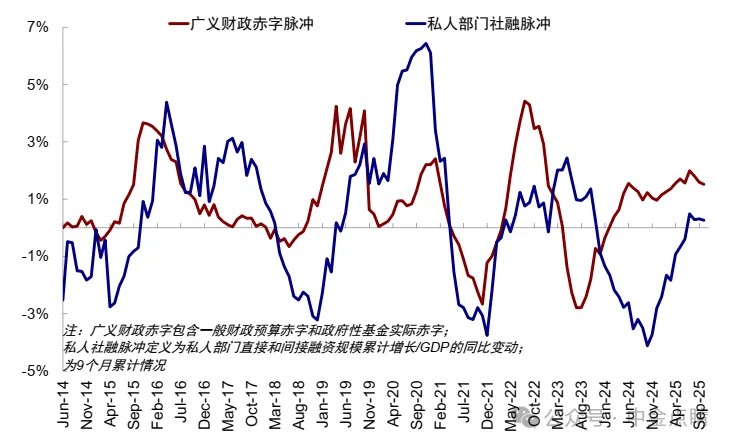
Source: Wind, CICC Research Department
Chart 13: Year-on-year decline in the scale of broad fiscal deficit in September
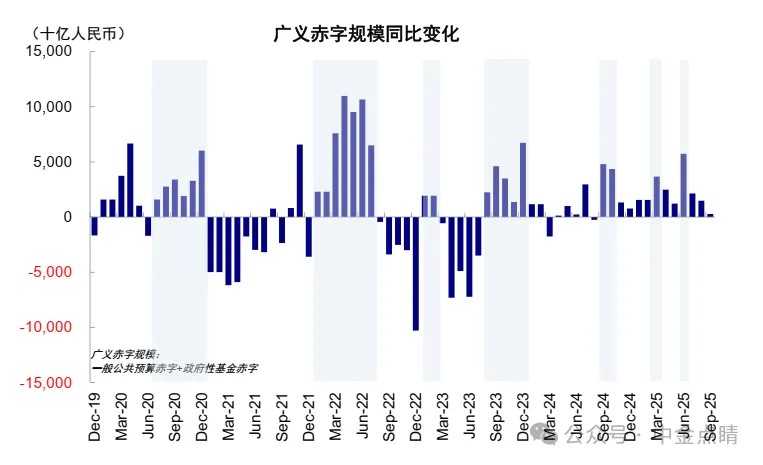 Source: Wind, CICC Research Department
The key variable that determines the future direction remains policy efforts. Except for certain technology sectors, the repair of the private credit cycle is not an overnight success; it still requires effectively improving income and return expectations while significantly reducing funding costs. However, in practice, there are many constraints, with real estate being the most typical example (sudden declines in interest rates and prices are unacceptable). The recent weakening of consumer data follows the same logic. In this environment, the importance of policy efforts to hedge becomes even more prominent, but the threshold for policy efforts may come from internal employment and external tariffs, which have not yet reached the urgency level similar to last year's 924 or this April's equivalent tariffs. Therefore, market expectations for substantial policy efforts are not high, focusing more on new fiscal tools targeting the technology and innovation sectors ("The Impact and Response to Tariff Upgrades").
Chart 14: Second-hand housing transaction area peaks and then falls back
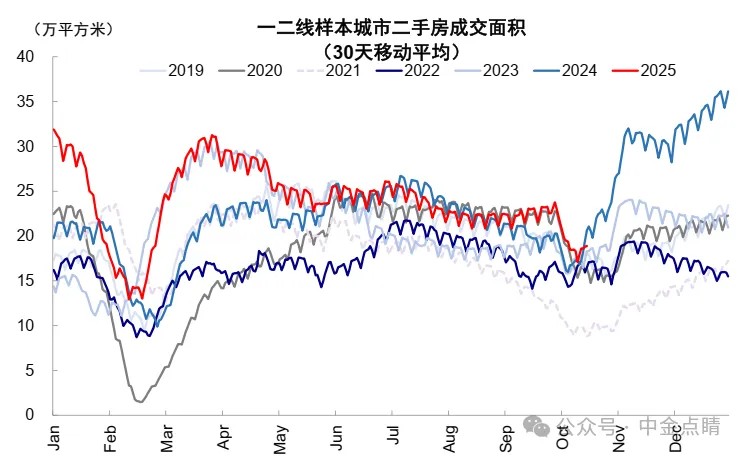
Source: Wind, CICC Research Department
Chart 15: The decline of the trade-in policy leads to a slowdown in the consumption growth of durable goods such as automobiles
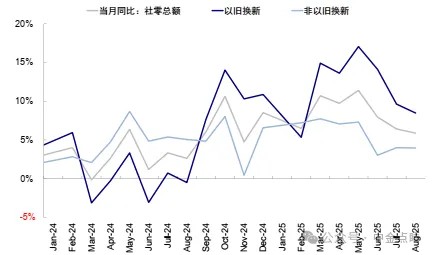
Source: Wind, CICC Research Department
If this is the case, referring to historical experience: 1) "Weak fiscal + weak social financing": indicates slow policy efforts, with bonds > commodities > stock market, greater pressure from credit contraction, commodities and stock markets under pressure, and the usual sector ranking being dividends > cycles > finance > consumption > growth. In an environment with high external uncertainty, gold may continue to benefit from safe-haven and store-of-value demand, outperforming copper. 2) "Strong fiscal + weak social financing": indicates policy efforts to hedge, with stock market fluctuations depending on the strength and direction of fiscal efforts, benefiting bonds, and the usual sector ranking being cycles > finance > dividends > consumption > growth, with infrastructure investment supporting cyclical sectors, and copper outperforming gold.
It is worth noting that the weakening of social financing indicates overall weak demand from the private sector, but emerging technology investments are likely to remain active, which is a difference in this cycle compared to previous ones. The credit expansion in some new economy sectors led by AI, against the backdrop of insufficient traditional demand, constitutes the current economic structure and does not contradict the analysis framework of the credit cycle. Instead, it points the market in a direction where macro growth is unlikely to improve quickly under a weakening credit cycle, and the market will continue to layout around the economic structure, making it difficult to switch significantly to low-position stocks like general consumption, the so-called "high cut low" (except for those driven by improvements in U.S. demand). This is also the baseline scenario for market expectations. Meanwhile, if fiscal efforts are not as strong as last year's 924 and are more focused on technology and innovation, this trend will be reinforced. Therefore, in summary, if there is a lack of substantial policy efforts to hedge, the market is likely to either continue the economic structure or enter a phase of risk aversion Article authors: Liu Gang, Wang Muyao, source: CICC Insights, original title: "CICC: Gold, Dividends, and Growth"
Risk Warning and Disclaimer
The market has risks, and investment requires caution. This article does not constitute personal investment advice and does not take into account the specific investment objectives, financial situation, or needs of individual users. Users should consider whether any opinions, views, or conclusions in this article are suitable for their specific circumstances. Investment based on this is at one's own risk
