

Strong Dollar Trend Leading Indicator: The "Resonance Pattern" of U.S. Stocks, U.S. Bonds, and the Dollar Index

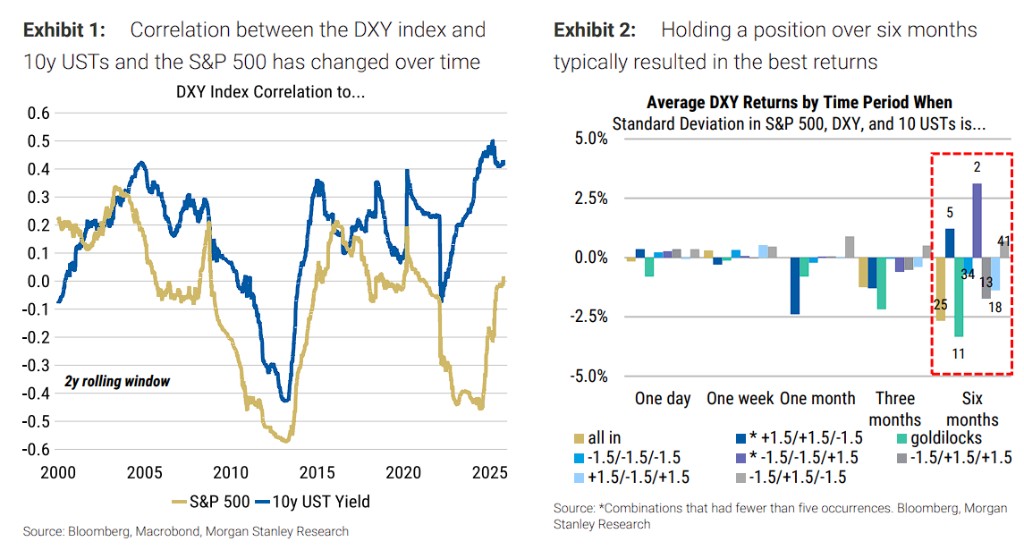
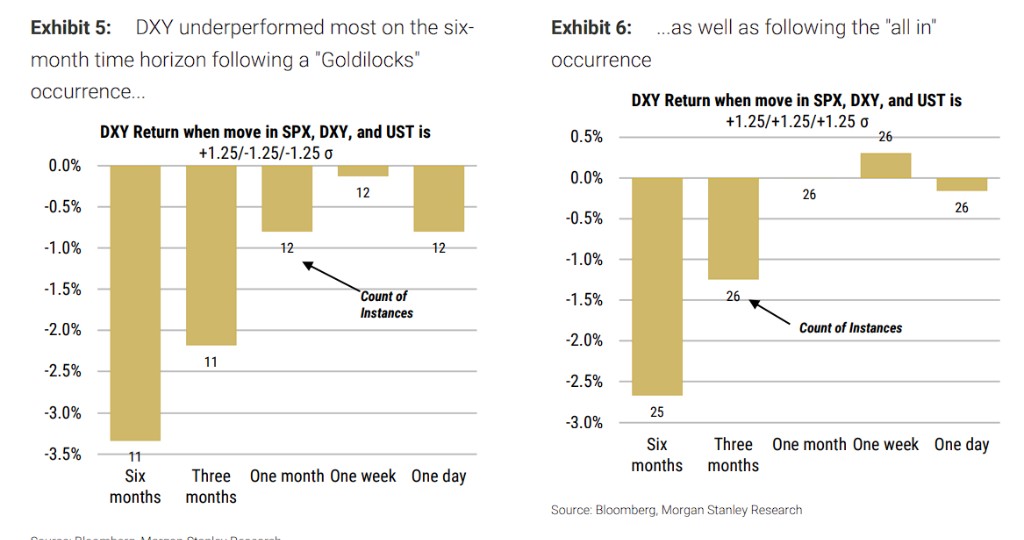
Morgan Stanley's latest research points out that when the S&P 500, U.S. Treasury yields, and the U.S. Dollar Index experience extreme "resonance," it signals an impending reversal of the dollar's strong cycle. The study shows that over the past 25 years, simultaneous extreme fluctuations in the S&P 500, U.S. Dollar Index, and 10-year U.S. Treasury yields often lead to a weakening of the dollar in the following six months. Particularly in the "Goldilocks" scenario, the dollar performs the worst, averaging a decline of 3.3%
Morgan Stanley's latest research points out that when the S&P 500, U.S. Treasury yields, and the U.S. dollar index experience extreme "resonance," it often signals an impending reversal of the dollar's strong cycle.
On October 20, according to news from the Chasing Wind Trading Desk, Morgan Stanley stated in its latest research report that when the S&P 500 index, the U.S. dollar index, and the 10-year U.S. Treasury yield exhibit extreme "resonance," the dollar tends to show predictable trend patterns in the next six months.
The bank's strategists, including Molly Nickolin, noted that by analyzing trading days over the past 25 years when the S&P 500 index, the 10-year U.S. Treasury yield, and the U.S. dollar index all experienced extreme fluctuations (over 1.25 standard deviations), they identified two clear signals indicating a weakening dollar in the next six months.
The bank stated that historical data shows that in the "Goldilocks" scenario (where the stock market rises more than 1.25 standard deviations while the dollar and Treasury yields both fall more than 1.25 standard deviations) and the "Broad Rally" scenario (where the S&P 500 index, the U.S. dollar index, and the 10-year U.S. Treasury yield all rise more than 1.25 standard deviations), shorting the dollar yields significant returns.
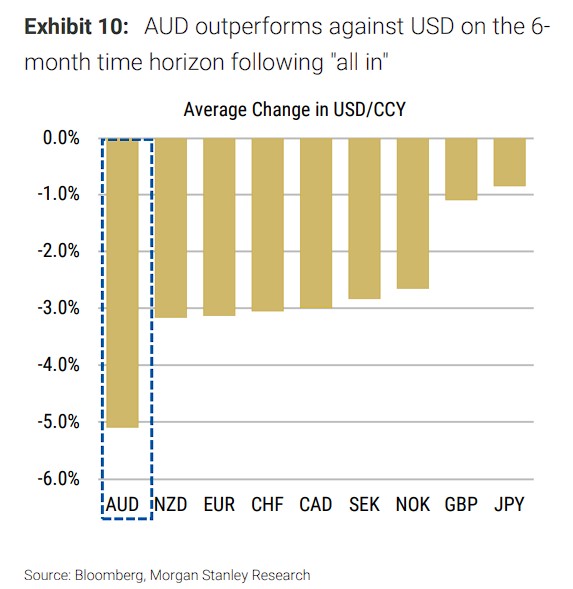
Morgan Stanley emphasized that in the "Goldilocks" scenario, the best performance of the British pound may reflect expectations of a soft landing; while in the "Broad Rally" scenario, the Australian dollar leading the way may suggest a decline in the U.S. exceptionalism narrative and a process of global economic catch-up.
It is noteworthy that in 2025, there have been multiple trading days that align with these signals, accounting for about 7% of the historical total, indicating that current market volatility is at historically high levels.
"Goldilocks" Scenario: The Most Reliable Signal for Shorting the Dollar
The Morgan Stanley team defines a standard deviation exceeding ±1.25 as "super large" fluctuations, using a 10-year rolling window for calculations. Among the eight possible combinations of the three key indicators—the S&P 500, the U.S. dollar index, and the 10-year U.S. Treasury yield—the "Goldilocks" scenario stands out the most.
The specific characteristics of this combination are: S&P 500 index standard deviation ≥ +1.25, U.S. dollar index standard deviation ≤ -1.25, 10-year U.S. Treasury yield standard deviation ≤ -1.25. Over the past 25 years, this combination has occurred 12 times, averaging a 3.3% decline in the U.S. dollar index within six months.
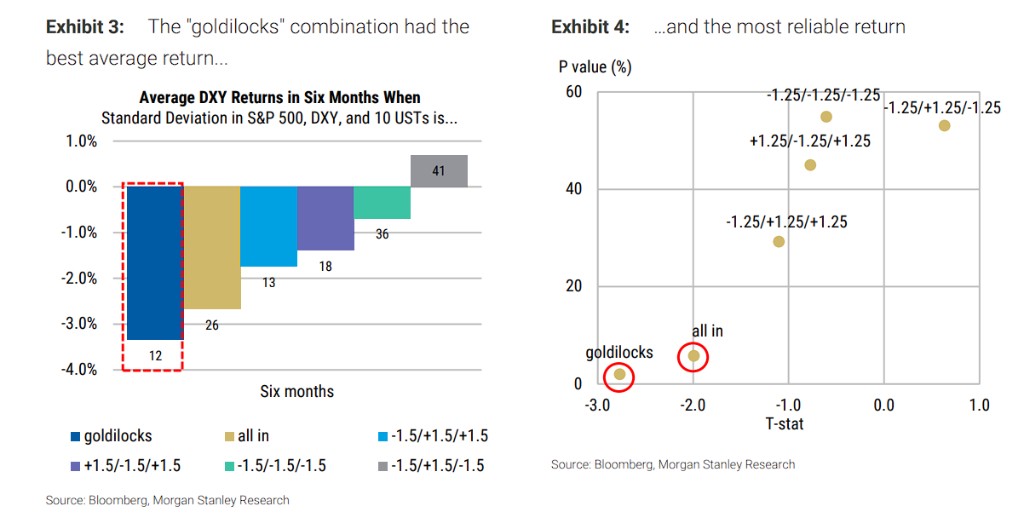
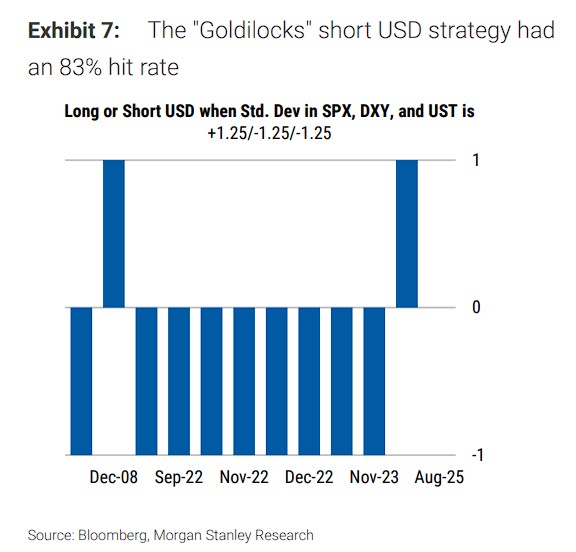
Statistical tests show that the t-statistic for this signal is -2.8, with a p-value of about 0.02, indicating a highly consistent causal relationship between this combination and a weakening dollar. In terms of hit rate, after 12 occurrences, the dollar weakened in 83% of cases within six months, far exceeding other combinations
Morgan Stanley stated that historical data shows that after the "Goldilocks" scenario appears, going long on the British pound against the US dollar yields the best returns.
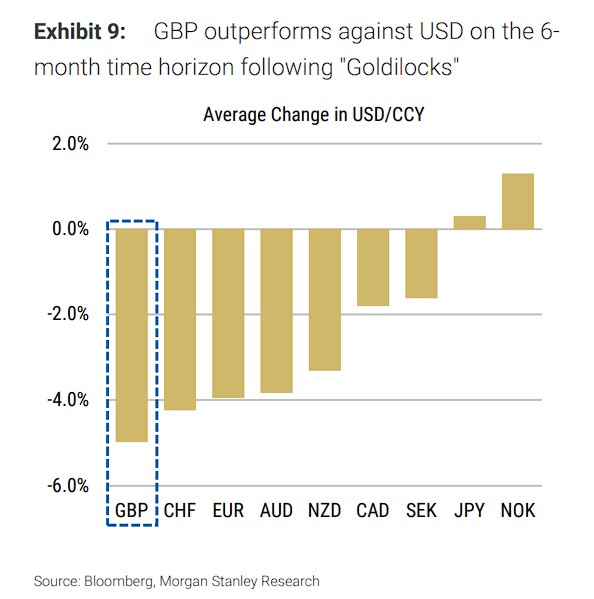
This may be because the signal suggests a "soft landing" scenario—US stocks rising reflects economic resilience, but the decline in the US dollar and US Treasury yields indicates an increase in expectations for Federal Reserve policy easing, which is beneficial for developed market currencies like the British pound.
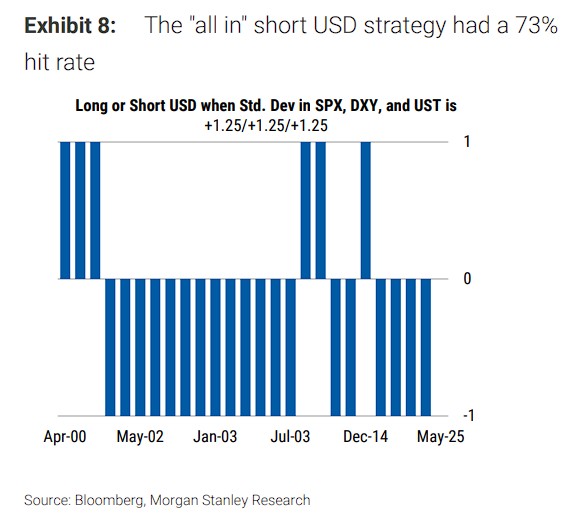
"Broad Rally" Scenario: The Second Most Reliable Signal to Short the Dollar
The "Broad Rally" scenario indicates that the S&P 500 index, the US dollar index, and the 10-year US Treasury yield all rise simultaneously by more than 1.25 standard deviations. This combination has occurred 26 times in the past 25 years, with a frequency about twice that of the "Goldilocks" scenario.
Although it occurs more frequently, the reliability of this scenario is slightly lower. Data shows that in the 6 months following the "Broad Rally" scenario, the US dollar index averages a decline of 2.7%, with a t-statistic of -2.0 (p-value around 0.06), indicating moderate evidence supporting a subsequent weakening of the dollar.
The success rate of this strategy is 73%—out of 26 occurrences, the dollar fell in the following 6 months 19 times. In terms of currency pair performance, the Australian dollar against the US dollar performed the best after the "Broad Rally" scenario.
The research suggests that this may reflect a global economic catch-up phase following "American exceptionalism":
A significant rise in all three indicators usually means that the US economy and market are performing extremely well, but subsequently, other regions' economies begin to recover, narrowing the gap with the US, leading to a pullback in the dollar's gains.
Morgan Stanley stated that the Australian dollar, as a typical risk currency and commodity currency, often performs well during a synchronized global economic recovery phase.
The above exciting content comes from the Wind Trading Platform.
For more detailed interpretations, including real-time analysis and frontline research, please join the【 **Wind Trading Platform ▪ Annual Membership**】

Risk Warning and Disclaimer
The market has risks, and investment requires caution. This article does not constitute personal investment advice and does not take into account the specific investment goals, financial situation, or needs of individual users. Users should consider whether any opinions, views, or conclusions in this article are suitable for their specific circumstances. Investing based on this is at one's own risk