

Why did gold prices plummet? Goldman Sachs traders: The gold price chart looks like the collapse of a speculative stock

Goldman Sachs analyzed that this sharp decline had no "obvious trigger," mainly attributed to the market becoming extremely crowded with long positions after nine consecutive weeks of gains, leading to a technical "liquidation." ETFs became the main battleground for this round of sell-off, with the trading volume of gold ETFs once accounting for 8% of the total nominal trading volume of all listed ETFs in the United States, setting a record high. Traders hinted that this could be a "buying on dips" opportunity, and once the market shows signs of stabilization, funds will flow in
After several weeks of strong gains, the gold and silver markets experienced a dramatic day yesterday.
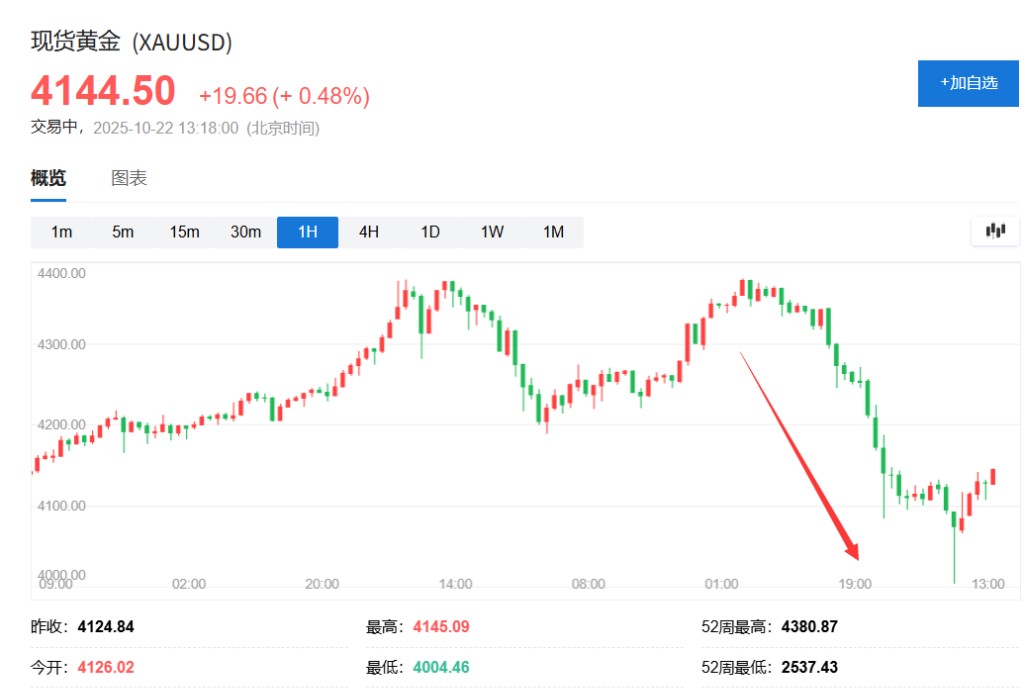
On Tuesday, October 21, the spot gold price plummeted by 6.3% during the trading session, nearing the $4,000 mark, marking the largest single-day drop in over 12 years. This volatility is considered a rare "5 sigma" event.
Spot silver fell even more, dropping by 8.7% at one point. This sudden wave of selling ended the previous week's momentum, where gold and silver prices had reached historic highs. A Goldman Sachs trader commented:
The gold price chart looks like a crashing "meme stock."
The severe turbulence in the gold market quickly transmitted to related stocks. Major gold producers Barrick Gold, Newmont Mining, and Agnico Eagle Mines all saw their stock prices drop by over 8% in early trading on Tuesday.
Previously, market expectations for significant interest rate cuts by the Federal Reserve before the end of the year, along with investors engaging in "inflation hedging trades" to counter sovereign debt and currency devaluation risks, had driven gold prices to soar. However, Tuesday's crash indicates that even in seemingly favorable macro conditions, overheated market sentiment can trigger severe corrections.
Currently, spot gold has rebounded slightly, trading up at $4,132 per ounce.
"No obvious trigger," is overcrowded positioning the main cause?
According to Adam Gillard, an expert from Goldman Sachs' commodity trading desk, there was "no obvious trigger" for the drop in gold prices. He noted that prices first declined during the Asian trading session, which then triggered stop-loss orders when the London and U.S. markets opened.
Gillard believes that since the previous rally was rarely driven by specific "headline news," but rather sustained by a broader "currency devaluation theme," it is difficult to attribute this pullback to any specific negative news. This may reinforce the view that technical factors are the dominant force.
As for the largest percentage drop in a decade, the best explanation may be the "positioning" issue. Gillard noted that after nine consecutive weeks of gains, the market became unusually crowded.
Some market observations provided by Goldman Sachs traders also confirm this: on days when gold prices rose by about $50, "we hardly received any inquiries from clients"; gold was the most popular long position among clients, with over 80% of respondents in most client surveys believing that gold prices would rise before the end of the year; at the same time, an increasing number of accounts outside the commodity sector began to allocate to gold.
Based on this, Adam Gillard believes that a "cleaning out" of positions may be inevitable.
ETFs become the main battleground for selling
Exchange-traded funds (ETFs) played a central role in this market volatility, becoming the primary tool for investors to quickly establish and liquidate positionsAccording to Goldman Sachs data, the trading volume of the gold ETF GLD once accounted for 8% of the total nominal trading volume of all listed ETFs in the United States, the highest share recorded in its database.
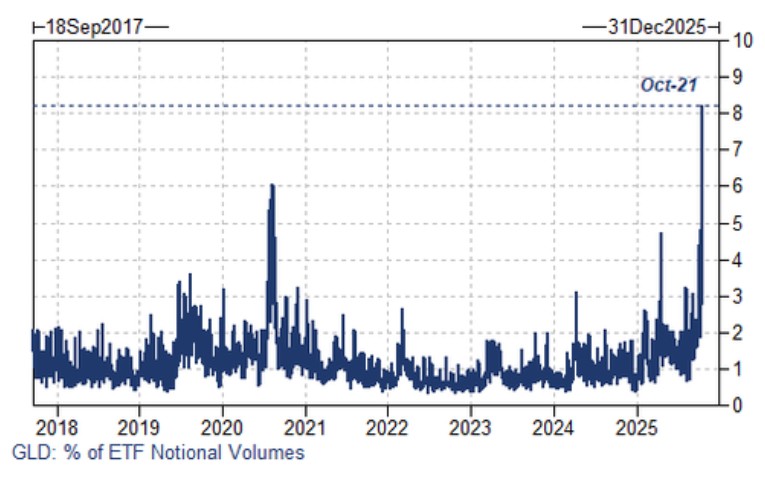
In addition, since February of this year, the assets under management (AUM) of U.S.-listed spot gold ETFs have nearly doubled, with more than half of the annual capital inflow occurring in the past three months. Meanwhile, the nominal value of open interest in GLD (gold) options has also reached a historical high.
In contrast, while the trading volume of gold futures at the Chicago Mercantile Exchange has increased, it has not set a new high for the year, indicating that a large number of positions are concentrated in ETF products.
Is this the prologue to a crash or a short-term fluctuation?
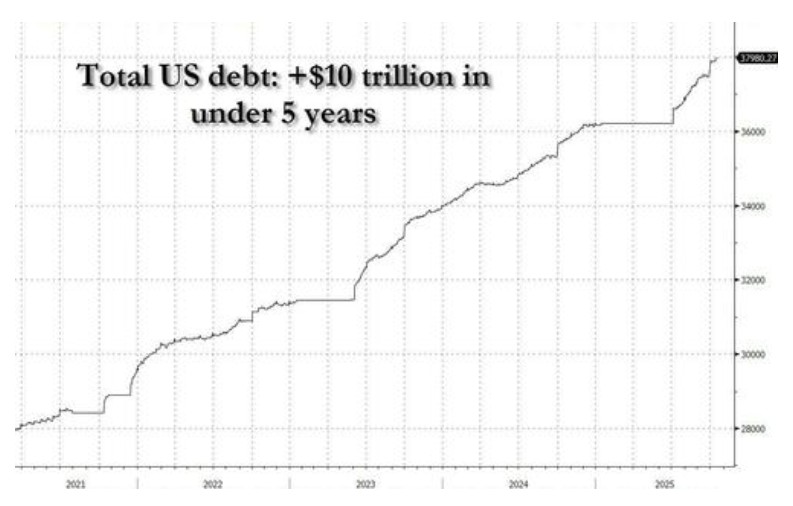
Despite the market experiencing a sharp decline, Goldman Sachs believes that the long-term macro backdrop driving gold prices higher has not changed. For example, the total U.S. national debt has just reached a historic high of $37.98 trillion.
Goldman Sachs traders believe that the higher the gold price, the larger the group of people who have not invested but want to invest. Therefore, they expect that once the market shows signs of stabilization, there will be capital inflows.
They pointed out that the price level of $4,000 per ounce needs to be maintained. The market is also watching whether physical buyers in Asia will enter the market the next day after gold prices on the Shanghai Gold Exchange show relative resilience
