

"AI Bubble" is trending! What were the peak signals of the "Dot-com Bubble" in 2000, and what did the "top" trend look like?

UBS warns that the conditions for an AI bubble are maturing, but key peak signals have not yet appeared, and the market is still in the early stages. The peak signals of the tech bubble include: extreme valuations, peak profit momentum, sharp economic slowdown, and frequent large-scale mergers and acquisitions. The top trend is not a one-sided decline, but rather a sharp drop followed by a rebound forming a "double top," ultimately continuing to decline under the pressure of economic recession
Author: Dong Jing
Source: Hard AI
As the wave of AI sweeps across the globe, discussions about the AI bubble are heating up. UBS recently warned that the conditions for an AI bubble are maturing, but key peak signals have yet to appear, and the market is still in its early stages.
On October 30th, according to Hard AI, UBS's global equity strategy team pointed out in their latest research report that the current market has met 6 out of the 7 preconditions for bubble formation. If the Federal Reserve lowers interest rates as predicted, all bubble conditions will be satisfied. However, compared to the tech bubble of 2000, key peak signals such as valuation, earnings momentum, and investment scale have not yet appeared, indicating that the market is still in the "early stages of a potential bubble."
The research report states that the current price-to-earnings ratio of the Mag 6 tech giants is 35 times, significantly lower than the 60 times level of the Nasdaq during the tech bubble. The valuation premium of tech stocks relative to the market is about 40%, while in 2000, this premium reached as high as 160%. The equity risk premium remains around 3.7%, significantly higher than the 1% level at the peak of the 2000 bubble. These data indicate that despite the market frenzy surrounding AI themes, the degree of valuation extremity has not yet reached historical bubble peaks.
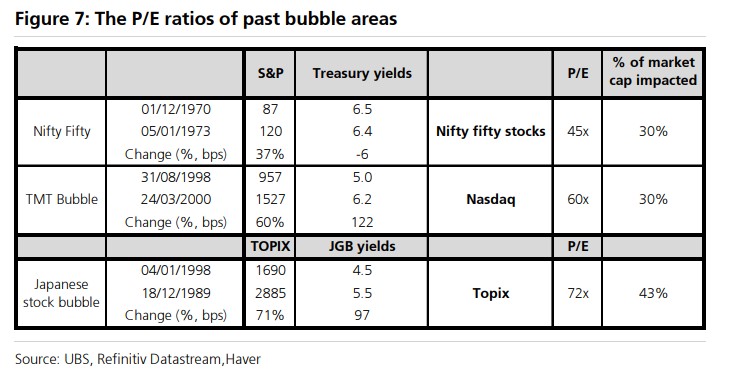
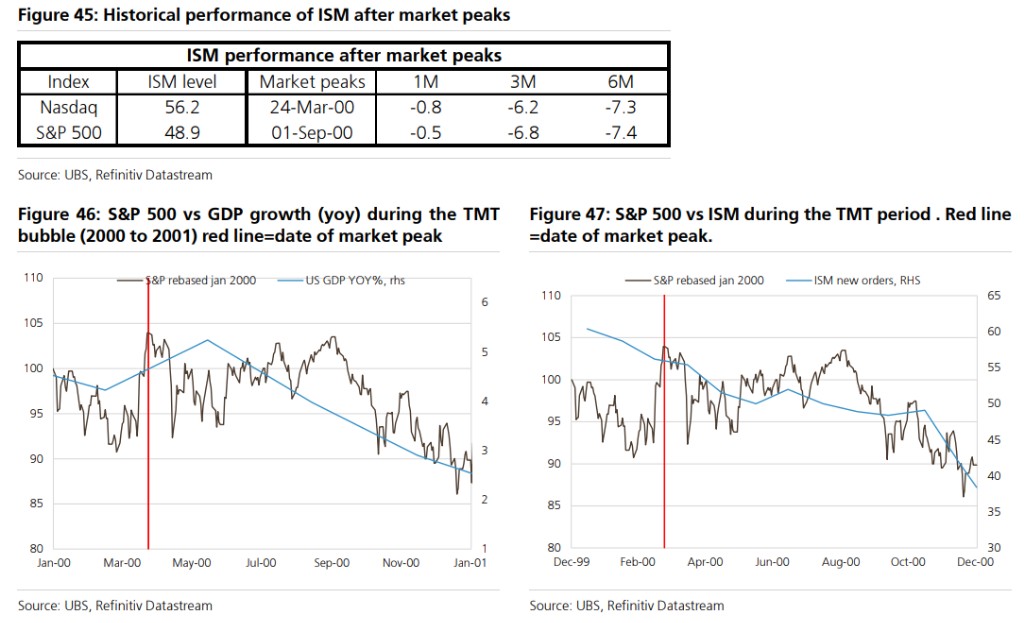
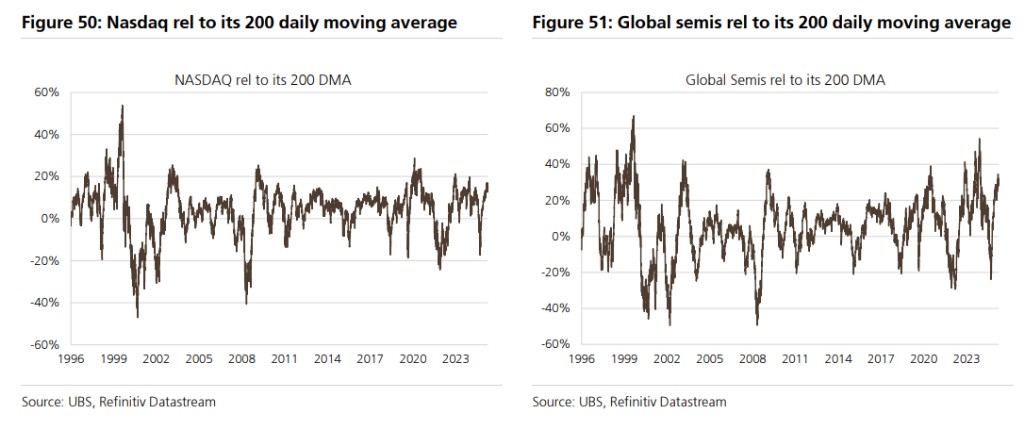
Reviewing the market characteristics before the peak of the 2000 tech bubble, UBS identified three key signals: valuation extremity, the failure of long-term catalysts, and the emergence of short-term triggering factors. At the bubble peak, the market exhibited five obvious characteristics: the equity risk premium dropped to 1%, earnings momentum peaked a year in advance, the ISM new orders index plummeted by 17 points within ten months, semiconductor stock prices had a premium of 70% over the 200-day moving average, and large-scale mergers and acquisitions were frequent.
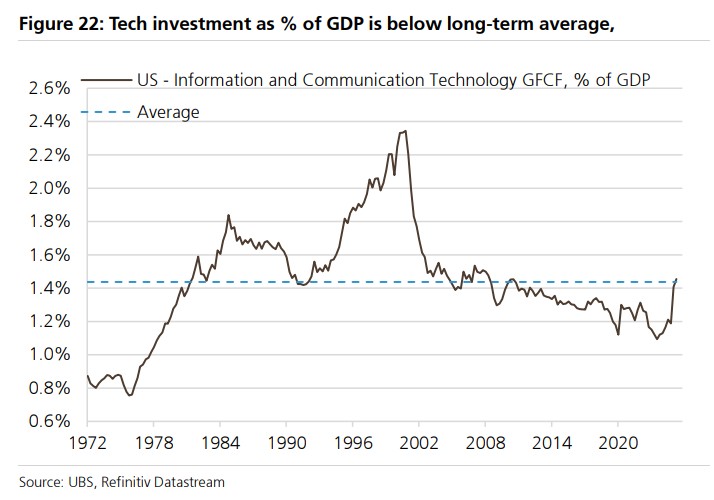
The report emphasizes that the current ICT (Information and Communication Technology) investment as a percentage of GDP is far below the levels of 2000, and leading large-scale cloud service providers are still financing capital expenditures with cash rather than debt. The market breadth and earnings momentum have not shown signs of deterioration seen during the tech bubble. UBS assesses that "if there is a bubble, it may manifest in the high profit margins of tech stocks and semiconductors," which could come under pressure as business capital intensity increases and competition intensifies.
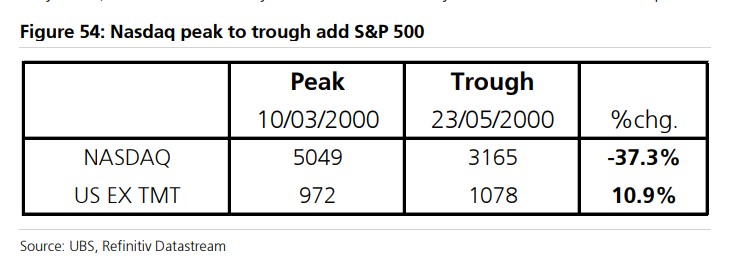
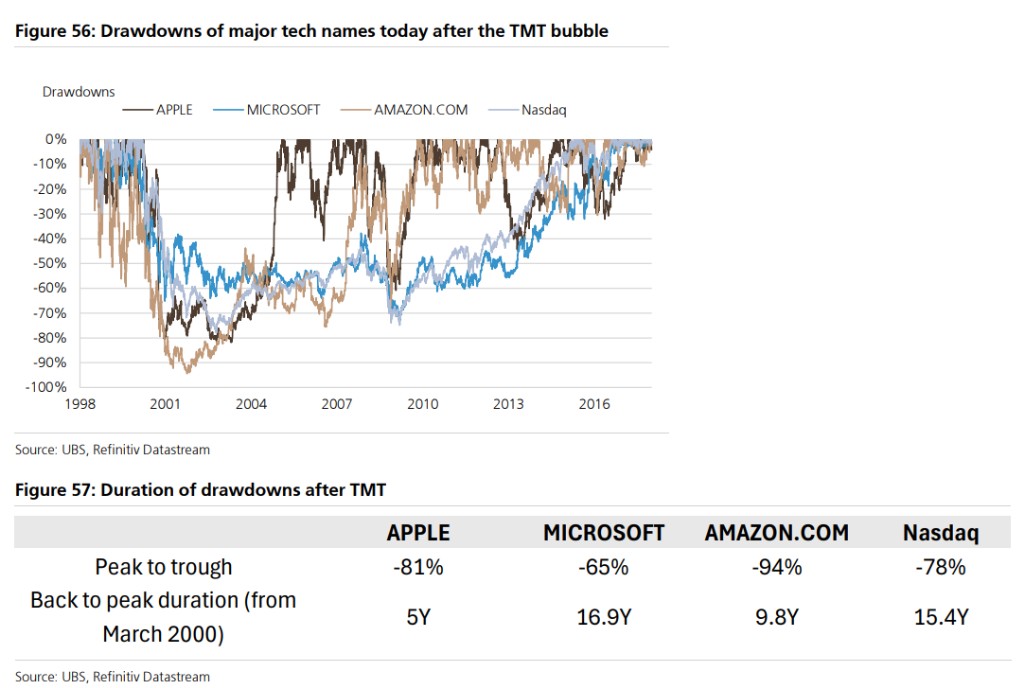
UBS points out that the market trends following the burst of the tech bubble are also worth referencing. The Nasdaq index fell 37.3% from its peak in March 2000 to May of that year, followed by a rebound forming a "double top," but ultimately continued to decline under economic recession pressure. The stock prices of tech giants like Microsoft, Amazon, and Apple fell by as much as 65% to 94%, taking 5 to 17 years to return to previous highs.
The "Rational" Foundation of the Current AI Wave
UBS believes that compared to the tech bubble of 2000 or the late 1980s Japanese stock market bubble, the current AI-driven market rally has a more solid fundamental support. The speed of generative AI application adoption far exceeds that of internet technology back in the day. OpenAI accumulated 800 million users in three years, while Google took nearly 13 years to reach a similar scale.
UBS notes that if the market believes generative AI can increase productivity by 2% like during the tech bubble era, the stock market could easily gain 20% to 25% in upside potential. The current market pricing implies about a 20% probability of a bubble From a corporate perspective, AI has demonstrated practical benefits in multiple fields. LG Display has reduced its quality improvement cycle from three weeks to two days through an AI-driven production system, saving $144 million annually. Sky announced a 7% workforce reduction, replacing it with AI services, while Tesco stated that AI has reduced delivery mileage by 100,000 miles per week. In the medical field, AI tools have improved cancer prediction accuracy to 78.4%, reducing detection time from weeks to minutes.
Another unique support for this round of market is the structural difference in the balance sheets of governments and corporations. In 2000, the U.S. government achieved a fiscal surplus, with government debt accounting for only half of the current GDP ratio. Today, the risk on the government balance sheet is significantly higher than that of corporations, which may prompt investors to shift from nominal assets to physical assets.
UBS believes that the probability of the Federal Reserve ultimately being forced to resolve government debt issues through money printing is at least 40%, which would further reduce equity risk premiums.
Three Major Signals of Bubble Peak
1. Five Standards of Extreme Valuation
UBS has summarized five methods for assessing bubble peak valuations.
Historical data shows that at bubble peaks, the price-to-earnings ratio of at least 30% of stocks reaches between 45 and 72 times, and the yield on ten-year government bonds reaches at least 5.5%. Currently, the 12-month trailing price-to-earnings ratio of Mag 6 is 35 times, which has not yet reached extreme levels.
Equity risk premium is another key indicator. At the peak of the bubbles in 2000 and 1929, the equity risk premium fell to about 1%. Currently, this indicator is around 3.7%, significantly higher than historical bubble levels.
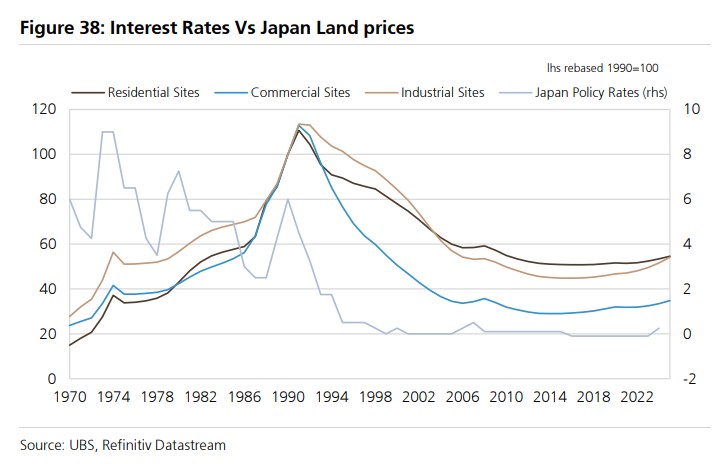
The shift in valuation methodology is also worth noting. During Japan's 1989 bubble, investors began to assess stocks based on land value rather than price-to-earnings ratios, at a time when real estate yields were below 1% and Japanese government bond yields were close to 6%. During the tech bubble, the market began to use non-traditional metrics such as "price per user" or "price per eyeball," as many internet companies were not yet profitable.
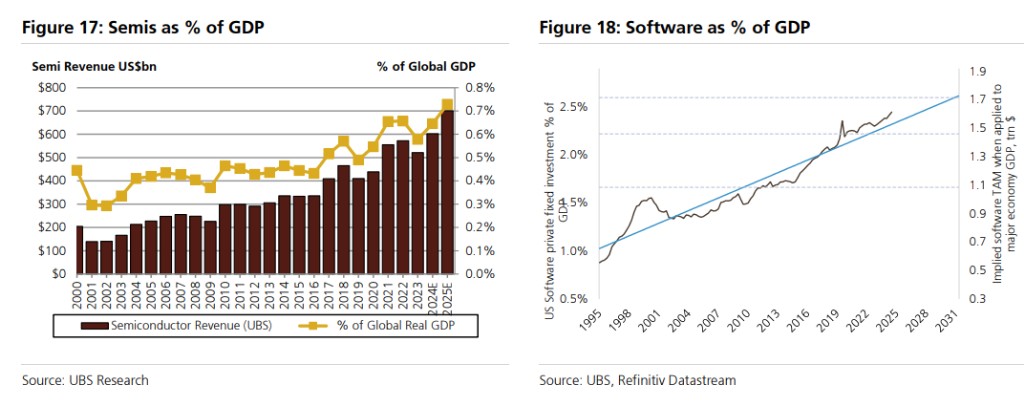
The reasonableness of the Total Addressable Market (TAM) is the fourth test standard. At the peak of the tech bubble, the household telecom spending required to support the valuations of telecom companies needed to reach about 20% of household income. UBS calculates that if 1.3% of global GDP is used to purchase semiconductors by 2030, the current valuation would be reasonable. Considering that semiconductors and software are the "new oil," currently accounting for about 3% of GDP, while oil historically averaged 3% (with a peak of 10%), this assumption is not unattainable.
Finally, the painful extent of investors losing about 80% after a bubble bursts is the ultimate manifestation of extreme valuation. It is currently difficult for the market to see a drop of 80% under Mag 6 2. Six Tests for Long-term Catalysts
UBS listed six long-term factors to determine whether a bubble is nearing its peak.
- Overinvestment is the primary warning signal.
In 2000, the investment in information and communication technology (ICT) accounted for a much higher proportion of GDP than the current level. Currently, ICT investment as a percentage of GDP is close to normal levels, and there is no obvious overinvestment.
- Debt financing expenditure is the second indicator.
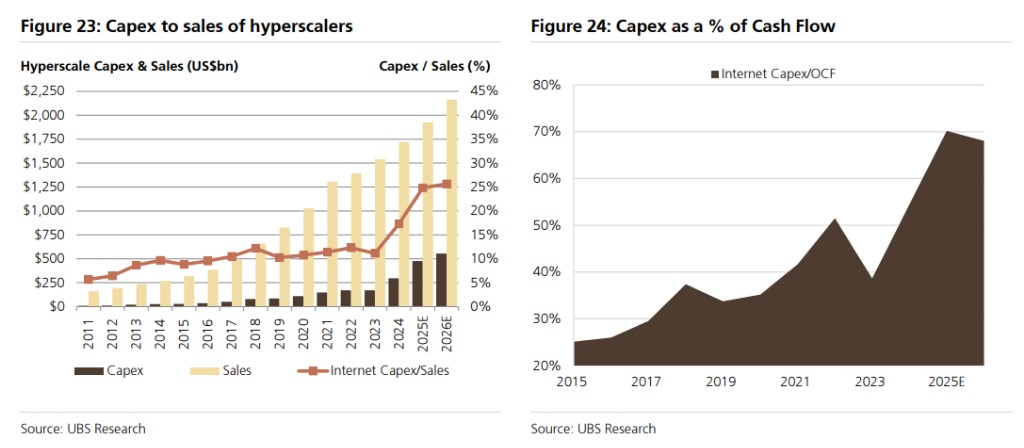
During the tech bubble, many internet companies relied on debt financing for expansion, with the net debt to EBITDA ratio of telecom operators reaching 3.5 times. Currently, the top 11 global hyperscale cloud service providers can increase capital expenditure by 40% without resorting to debt financing based on 2025 revenue data. The technology sector as a whole has net cash, and leverage levels are far better than during the tech bubble.
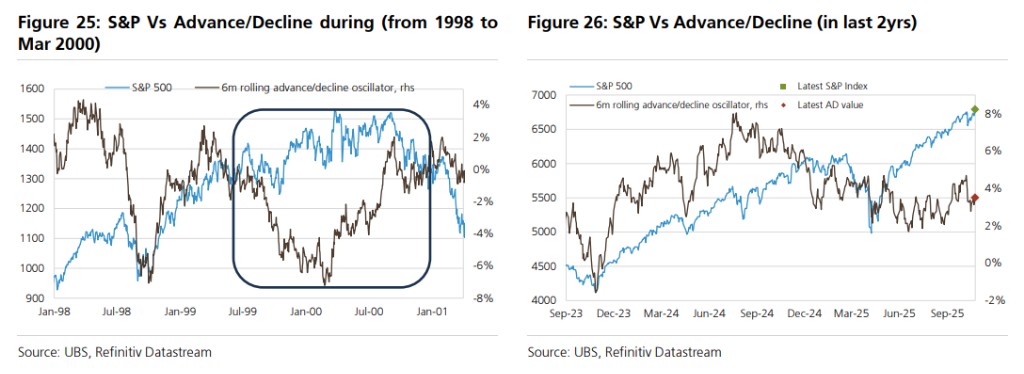
- Severe deterioration in market breadth is the third signal.
In 1999, the S&P 500 index rose by 20%, and the Nasdaq soared by 86%, but the number of declining stocks was nearly double that of advancing stocks. Although market breadth has narrowed currently, such extreme divergence has not yet occurred.
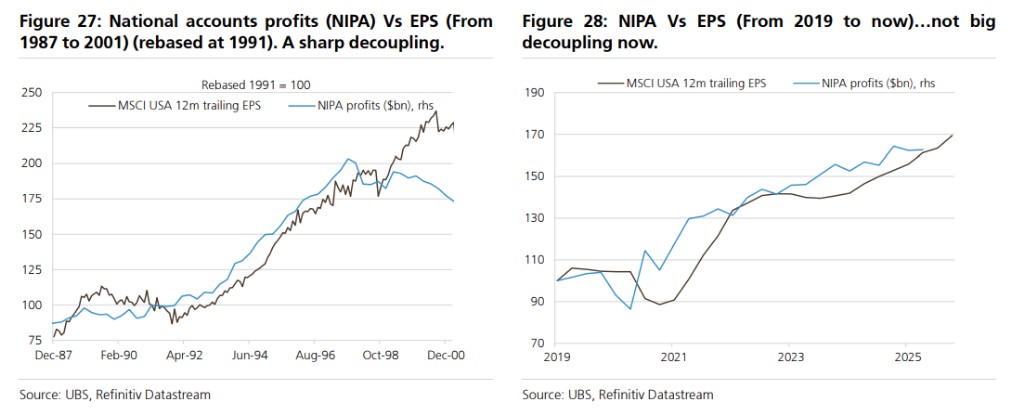
- The degree of pressure on national account profits is the fourth consideration.
During the tech bubble, U.S. national account profits declined, but the EPS of the S&P 500 was distorted due to stock option compensation not being accurately accounted for. Currently, except for the top ten companies, the forward EPS growth of other S&P 500 constituents is close to zero, but the divergence between national account profits and EPS is far less than in 1999.
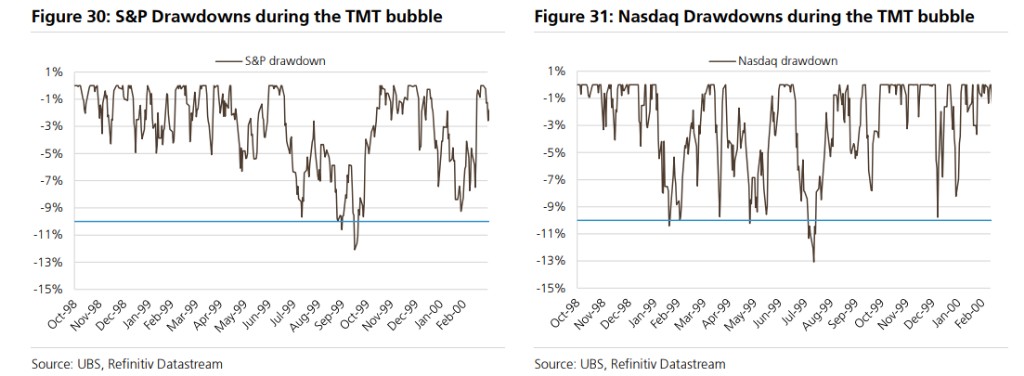
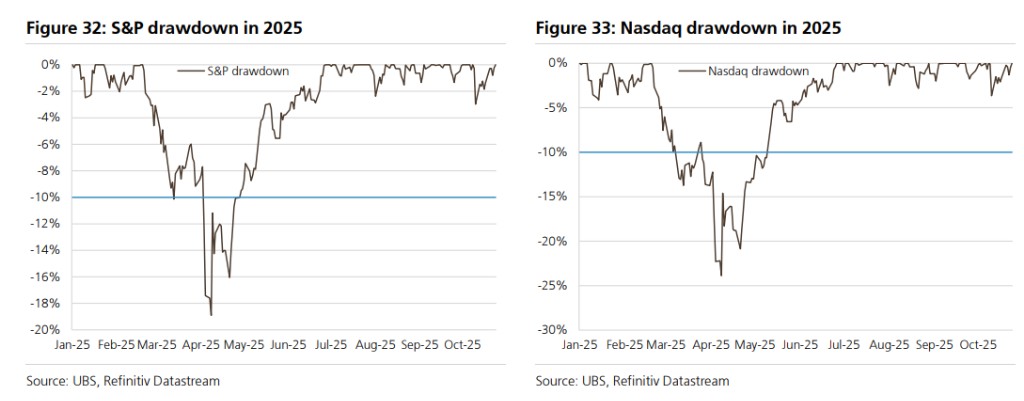
- Increased market volatility is the fifth characteristic.
From November 1998 to February 2000, the Nasdaq experienced five adjustments of over 10%, while the S&P 500 had two.
Since April 2025, both indices have seen very little pullback
- Finally, the tightening of monetary policy or the central bank actively bursting the bubble.
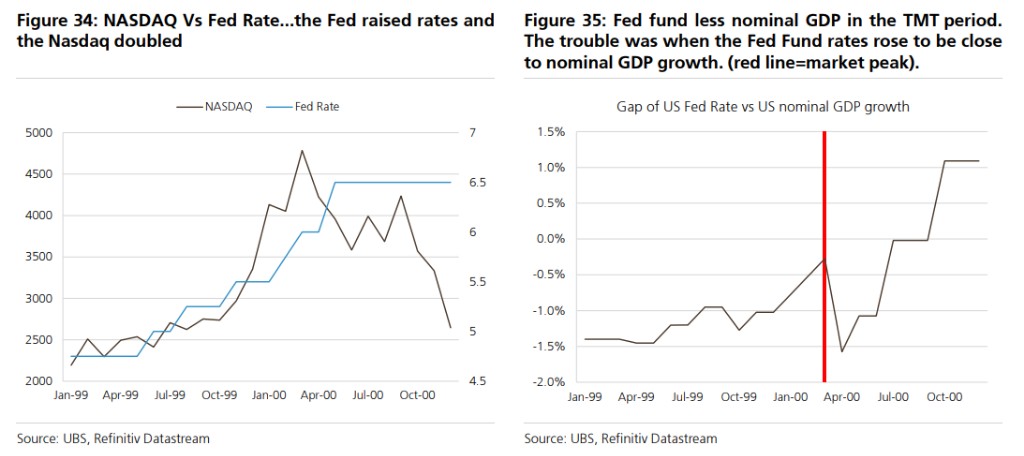
The Federal Reserve raised interest rates from 4.75% to 5.75% during the tech bubble, and the Nasdaq nearly doubled; it wasn't until February 2000, when rates were raised to 6%, close to the nominal GDP growth rate, that the market peaked. The current nominal GDP growth rate is expected to be 5.2%, and the Federal Reserve's policy is still far from tightening.
In the case of Japan, Yasushi Mieno became the governor of the Bank of Japan on December 17, 1989, and raised interest rates on December 26, explicitly aiming to burst the bubble with a target of a 20% drop in real estate prices.
3. Four Observations of Short-Term Trigger Factors
UBS pointed out that short-term catalytic factors often suddenly appear in the final stages of a bubble.
The frequent occurrence of mega-mergers is a typical signal.
The Vodafone acquisition of Mannesmann was completed in February 2000, with a scale of $190 billion; AOL's acquisition of Time Warner was announced in January 2000, with a scale of $183 billion. Adjusted for the S&P 500 index increase, these two transactions are equivalent to about $900 billion each today.
A sharp slowdown in economic activity is the second trigger factor.
At the peak of the tech bubble, the ISM new orders index was 56.2, but by the end of 2000, it had plummeted below 40, a drop of 17 points within ten months. The sharp deterioration of the economy ultimately led to the U.S. entering a recession in February 2001.
Extreme levels of price momentum are the third warning.
During the tech bubble, semiconductor stock prices were at a 70% premium relative to their 200-day moving average, while the current premium is about 35%.
Finally, when people stop questioning whether a bubble exists and instead rationalize high valuations, it often means the peak is near. Investors begin to focus only on relative valuations and relative earnings adjustments, rather than absolute valuation levels
Where Are the Current Bubble Risks
UBS believes that if there is a bubble in the current market, it is most likely reflected in the profitability levels of the technology sector, especially the semiconductor industry.
The forward net profit margin of the U.S. technology sector has risen to historical highs over the past 12 months, and the net profit margin of the semiconductor industry is also near peak levels. As business capital intensity increases and competition intensifies, profit margins typically come under pressure. OpenAI's joint production of application-specific integrated circuits (ASICs) with partners, as well as its foray into areas like browsers or online advertising, may pose challenges to the profit margins of existing companies.
Nevertheless, UBS emphasizes that the current market is still in the "early stages of a potential bubble." The price-to-earnings ratio of tech stocks relative to the market is close to normal levels, earnings revisions are performing better, earnings growth is stronger, capital expenditures are in the early stages, and there is a lack of many excessive characteristics seen at historical bubble peaks.
Notably, OpenAI's announced data center construction plan of over 23GW, with a total cost exceeding $1 trillion, is more than double the capital expenditures of all hyperscale cloud service providers in 2025.
The financing nature of these deals is opaque and may resemble the "vendor financing" model from the tech bubble era. Nevertheless, OpenAI's current revenue scale is extremely small, and CEO Sam Altman has stated that "profitability is not among its top ten priorities."
Five Lessons from the Peak of the Tech Bubble
Historical experience is crucial for understanding market trends after a bubble bursts. UBS summarizes five key lessons from the bursting of the tech bubble:
In the early stages of a bubble burst, non-bubble sectors often perform well. During the Nasdaq's 37.3% decline from March to May 2000, non-tech stocks rose by 10.9%, while the S&P 500 overall fell by 10%. This provided investors with an opportunity to reallocate.
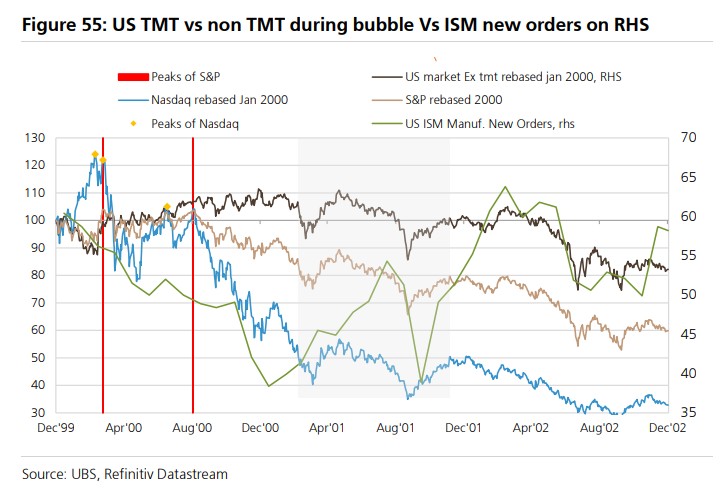
The "echo effect" is worth noting. In September 2000, the S&P 500 nearly returned to its previous high on March 24, just 0.4% short, but the Nasdaq was still 16% below its peak. This "double top" pattern can easily mislead investors.
Real bear markets are often accompanied by economic recessions. As the collapse of tech investments led to a sharp slowdown in economic activity, the ISM new orders index fell from 60 in January 2000 to 38 in January 2001, and the U.S. officially entered a recession in February 2001. Non-tech stocks fell 33% from their peak.
There are many cases where long-term concepts are correct but prices are severely wrong. Microsoft, Amazon, and Apple fell from their peaks by 65% to 94%, taking 5 to 17 years to return to previous highs. Many "Nifty Fifty" components also experienced similar fates. This reminds investors that even if they bet on the right technological trends, excessive valuations can still lead to long-term capital losses
Finally, the ultimate winners of the value chain may exceed expectations. The true winners of the tech bubble were not the telecom operators, but the users who could capture the value chain (such as Apple), businesses that leveraged social media (such as Meta and Google), and companies that provided irreplaceable key software (such as Microsoft). This indicates that investors need to think deeply about the value distribution pattern in technological changes.
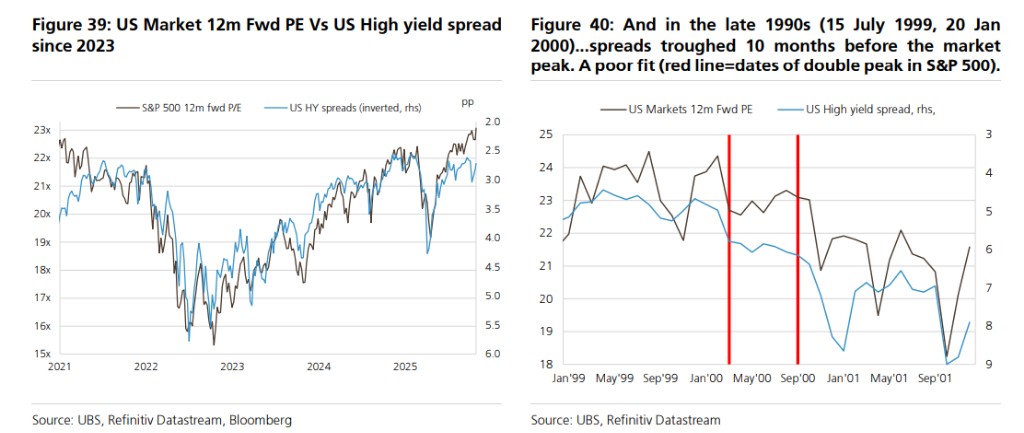
In addition, the bank believes that credit spreads are also an important observation indicator. During the tech bubble period, credit spreads bottomed out about ten months before the stock market peaked, as the debt market was heavily used for tech investments and financing. Currently, the correlation between tech stocks and credit spreads is higher, but this leading relationship may differ in this cycle.
UBS analysis indicates that although the AI theme has raised bubble concerns, several key indicators have not yet reached the extreme levels seen at historical bubble tops. Investors need to closely monitor multidimensional signals such as valuation, earnings momentum, investment scale, and market breadth to determine when the bubble transitions from the "early stage" to "peak risk."
