

At a sensitive moment, alarms are ringing in the U.S. stock market! The famous valuation indicator has "broken the red line for the second time in history," the last time being in 1999

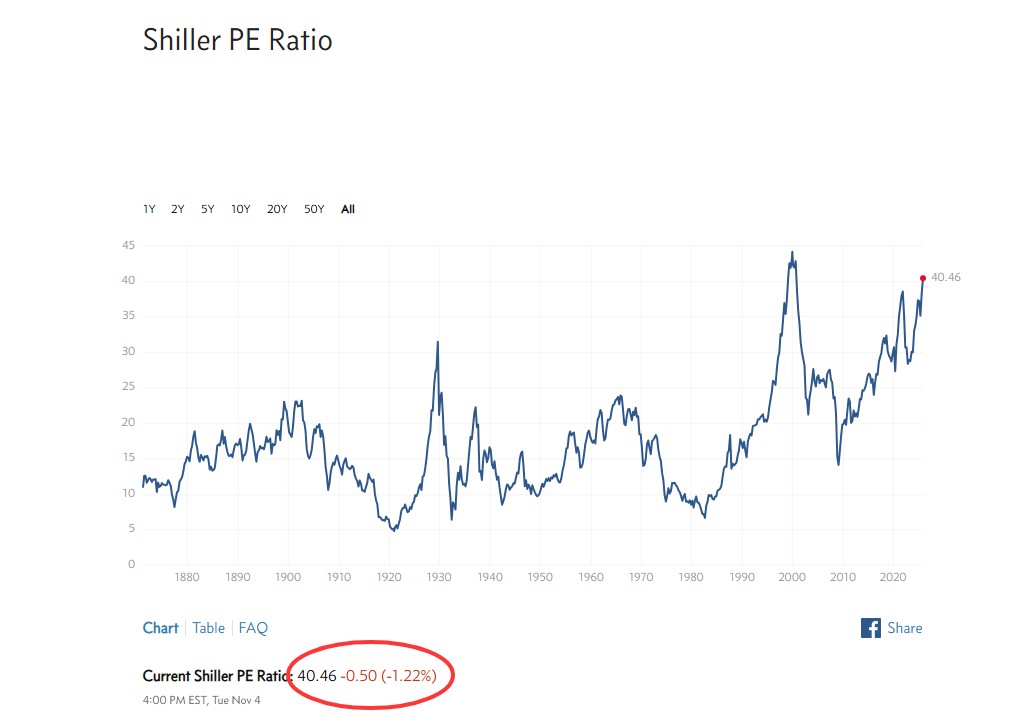
The famous valuation metric—Cyclically Adjusted Price-to-Earnings Ratio (Shiller P/E)—has recently surpassed 40, marking the second time in history it has reached this high level, the last occurrence being during the internet bubble in 1999. Predictions based on this valuation model indicate that the real returns of large-cap growth stocks in the U.S. over the next decade may be negative
A classic valuation method pioneered by legendary investor Benjamin Graham and promoted by Nobel laureate Robert Shiller is sending a clear signal to the market: lower return expectations for the coming years.
According to a recent report by The Wall Street Journal, the indicator known as the "Cyclically Adjusted Price-to-Earnings ratio" (CAPE or Shiller P/E) has recently surpassed the 40 mark. This is the second time in recorded history that this indicator has reached such a high level, the only previous instance being in 1999, at the peak of the tech stock bubble. This dynamic serves as a warning bell for the currently booming U.S. stock market.
Historically, peaks in the Shiller P/E have often been precursors to poor market performance in the future. Data shows that after the valuation peaks in 1929, 1966, and 2000, the U.S. stock market recorded negative real (inflation-adjusted) returns over the following decade. This historical pattern has led investors to harbor deep doubts about the sustainability of current valuations.
Despite the price-to-sales ratio of U.S. stocks also climbing to an all-time high, the weight of this warning signal feels particularly heavy. There is an increasingly tense opposition forming between market optimism and the cautious signals emitted by historical valuation models.
Valuation Alarm: The Rare "40" Threshold in History
The Shiller P/E measures stock prices by reviewing the average earnings adjusted for inflation over the past decade, aiming to smooth out the effects of business cycles and provide a more robust valuation perspective. Its long-term historical average is around 17 times.
Even considering changes in the modern economic structure and moving the statistical starting point to 1990, when computers and financial media became widespread, its average is still only 27 times.
Analysts note that the current level above 40 is extreme by any measure, indicating that current stock prices are at a high that has not been seen in 99% of historical time.
"This Time is Different"? The Debate Over High Valuations
There are plenty of voices in the market defending high valuations. One viewpoint argues that the companies within the index are of "higher quality" today, with a greater proportion of asset-light, high-margin companies like Microsoft than ever before. However, this explanation seems somewhat weak when faced with the "gold standard" of the Shiller P/E.
Another optimistic expectation hinges on the productivity revolution brought about by artificial intelligence (AI).
However, analysts point out that the impact of AI must be "truly transformative and lasting" to bring valuations back to historical average levels. Additionally, the belief that corporate profits will continue to grow is also challenged, as current U.S. corporate tax rates and labor costs are at low levels, trends that are unlikely to be sustainable, and may even reverse in the context of massive government deficits and an aging population
The Real Returns of the "Tech Giants" Are Expected to Be Negative Over the Next Decade
It is important to clarify that the Shiller P/E is not a precise market timing tool, and high valuation states may persist for a long time. However, it has significant reference value for indicating long-term risks. Analysis suggests that the currently high valuations will ultimately need to be corrected, and a decline in prices (P) is more likely than an unexpected increase in earnings (E).
However, there are still opportunities beneath the alarm. The index development organization Research Affiliates has established a predictive model based on the Shiller P/E, showing significant differentiation in expected returns across different asset classes. According to their calculations, over the next decade:
-
The annualized real return of large-cap growth stocks in the U.S., including the "Tech Giants," is expected to be -1.1%.
-
Large-cap value stocks in the U.S. are expected to achieve a positive return of 1.6%.
-
The outlook is even brighter for U.S. small-cap stocks, European stocks, and emerging market stocks, with expected annualized real returns of 4.8%, 5.0%, and 5.4%, respectively
