

How big is the U.S. stock market bubble? UBS provides seven observation indicators

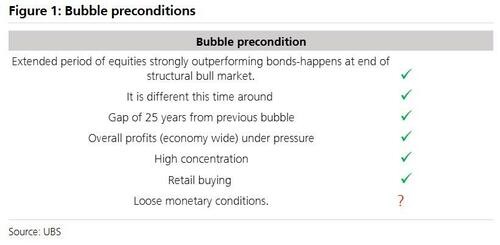
Current high valuations in the US stock market have raised concerns about a potential bubble. A UBS report points out that the market has seven indicators of bubble formation: the "buying the dip" mentality, the "this time is different" narrative brought by artificial intelligence technology, intergenerational memory gaps, overall profit growth under pressure, high market concentration, active participation of retail investors, and a loose monetary environment. However, the report believes that the market is still in the early stages of a potential bubble and has not yet reached a dangerous peak, as valuations have not reached extreme levels, the proportion of technology investment to GDP is manageable, and there have been no extreme merger and acquisition cases similar to those seen during the dot-com bubble as topping signals
As U.S. stock valuations remain high, discussions about whether the market has entered a bubble phase are becoming increasingly intense. Despite strong corporate earnings, Wall Street executives have begun to warn of potential pullback risks.
According to the Wind Trading Desk, UBS Group AG's latest report presents a framework consisting of seven indicators, concluding that the current market is in the early stages of a potential bubble and has not yet reached a dangerous peak.
They point out that the price-to-earnings ratio of technology stocks is close to normal levels relative to the overall market, with better earnings revisions and growth prospects, and the capital expenditure cycle is also in its early stages. Most importantly, the current market shows no signs of the excesses typically seen at historical bubble peaks.
UBS summarizes that if there is a bubble in the market, it may be reflected in the high profit margins of tech giants. With increasing capital intensity in the industry and intensifying competition, these high profit margins may face downward pressure in the future. However, for now, the market is still some distance from a truly dangerous moment.
Seven Preconditions for Bubble Formation
UBS equity strategist Andrew Garthwaite and his team propose in the report that the formation of a market bubble typically requires seven preconditions to be met. They believe that if the Federal Reserve's interest rate cut path aligns with UBS's predictions, all seven conditions will be triggered.
- Buy-the-dip mentality: Over the past decade, the annualized return of stocks relative to bonds has exceeded 14%, far surpassing the 5% threshold needed to foster this mentality.
- "This time is different" narrative: The rise of generative artificial intelligence (Gen AI) provides a powerful new technological narrative.
- Generational memory gap: It has been about 25 years since the last tech stock bubble (1998), making it easier for a new generation of investors to believe "this time is different."
- Overall profit pressure: In the U.S., excluding the top 10 companies by market capitalization, the 12-month forward earnings per share (EPS) growth of other companies is close to zero, similar to the profit situation during the dot-com bubble.
- High concentration: The current concentration of market capitalization and revenue in U.S. stocks is at historical highs.
- Active retail participation: Retail trading activity has significantly increased in regions such as the U.S., India, and South Korea.
- Loose monetary environment: Financial conditions are currently loose, and if the Federal Reserve cuts interest rates as expected, the monetary environment will loosen further.
Three Major Signals of a Bubble Peak
Although the conditions for a bubble are gradually being met, UBS believes that the market is still quite a distance from a true bubble peak. The report analyzes key signals indicating a market peak from three dimensions: valuation, long-term catalysts, and short-term catalysts.
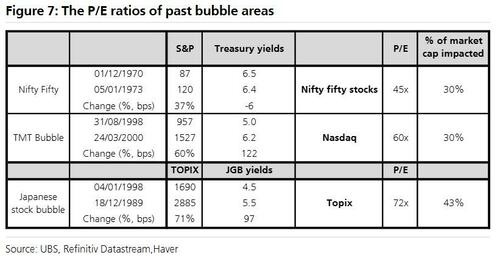
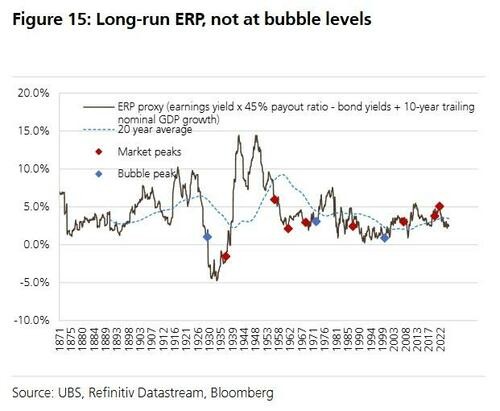
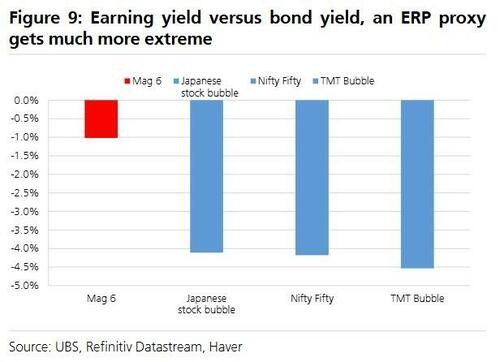
1. Clear overvaluation: Historical bubble peaks are usually accompanied by extreme valuations. For example, in previous bubbles, at least 30% of companies by market capitalization had price-to-earnings ratios rising to between 45 and 73 times, while the current dynamic price-to-earnings ratio of the "Magnificent Seven" (Mag 6) is 35 times At the same time, the equity risk premium (ERP) has not fallen to the extreme low of about 1% seen in 2000 or 1929.
2. Long-cycle peak catalysts: The report points out that several long-term indicators also do not show signs of a peak. First, the share of information and communication technology (ICT) investment in GDP is far below the levels of 2000, with no obvious signs of over-investment.
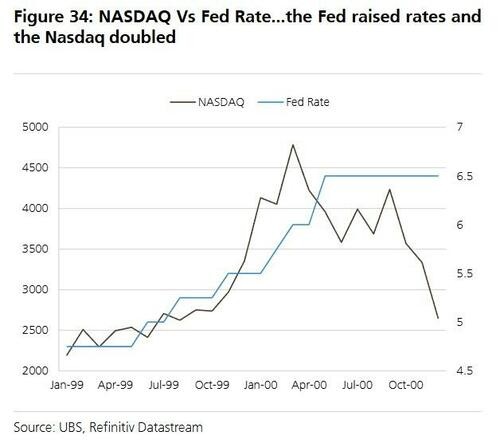
Second, the leverage of tech giants is far better than during the dot-com bubble period. In addition, market breadth has not deteriorated as severely as it did in 1999, when the Nasdaq index nearly doubled, but the number of declining stocks was almost twice that of advancing stocks.
3. Short-cycle peak catalysts: From a short-term perspective, the market also lacks urgent signals of a peak. For example, there have not yet been extreme mergers and acquisitions like Vodafone/Mannesmann or AOL/Time Warner in 2000. At the same time, the Federal Reserve's policy stance is far from the tightening level that would trigger a crash. Historical experience shows that the market only peaks when interest rates rise close to the nominal GDP growth rate (expected to be 5.2% in 2026).
Insights from the Post-TMT Era
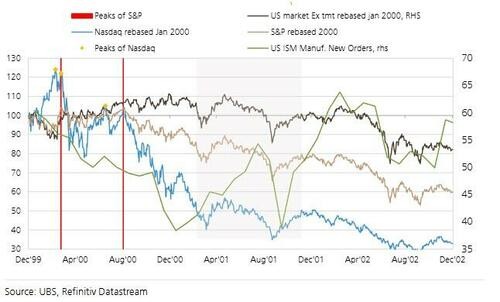
UBS reviewed the experiences following the burst of the technology, media, and telecommunications (TMT) bubble in 2000, providing investors with several insights. First, after the bubble burst, value may flow to non-bubble areas, with non-TMT stocks initially rising during the sell-off. Second, the market may experience an "echo effect" or double-top pattern. Most importantly, "the concept is correct but the price is wrong," as companies like Microsoft, Amazon, and Apple saw their stock prices plummet by 65% to 94% from their peaks, taking 5 to 17 years to recover.
**The report also emphasizes that the ultimate winners in the value chain may not be the builders of infrastructure, but rather the users who can leverage new technologies to create disruptive applications or critical software **
