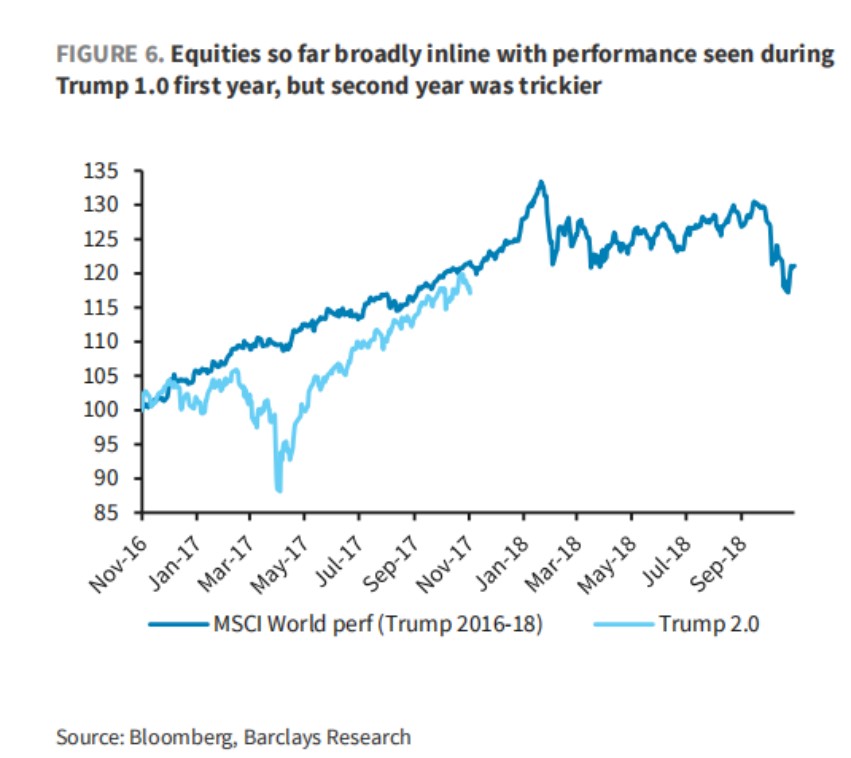
One year after the victory of "King of Understanding," the market trends of "Trump 2.0" and "Trump 1.0" are highly similar. The bad news is that the stock market performance in the second year is usually the worst

On the anniversary of Trump's election victory, market trends are highly similar to those during his first term: Bitcoin leads risk assets, emerging markets outperform U.S. stocks, and the dollar weakens. However, historical data shows that the second year of a presidential term is usually the worst time for U.S. stocks. During the "Trump 1.0" period in 2018, there was a surge in market volatility and a pullback in risk assets, which serves as a warning for the current market
On the anniversary of Trump's re-election as President of the United States, the market trend presents a strikingly similar picture to that of his first term.
According to the Chase Wind Trading Desk, on November 7, Barclays Bank released a report stating that the market performance in the first year after Trump's re-election almost perfectly replicated the trend following his first victory in 2016: risk assets (especially Bitcoin) soared, emerging markets outperformed the U.S., and the dollar weakened.
However, historical data sends a strong warning: the second year of a presidential term is usually the worst for U.S. stocks and the period of highest market volatility, as seen during the "Trump 1.0" era in 2018.
Additionally, tariff issues remain a sword hanging over the market; although the Supreme Court's ruling may have limited impact, the related uncertainty will continue to suppress specific sectors. Fund flows indicate that while a large amount of money has poured into cash (money market funds), the stock market, especially tech stocks, remains in high demand, reflecting a contradictory market sentiment.
Market Trends Remarkably Mirrored: "Trump 2.0" First Year Highly Similar to "1.0"
A full year has passed since Trump won the presidential election again in 2024. The global market has exhibited a trend remarkably similar to that following his first election in 2016. Although policy uncertainty is the main theme of the "Trump 2.0" term, it has not hindered the significant rise of risk assets.
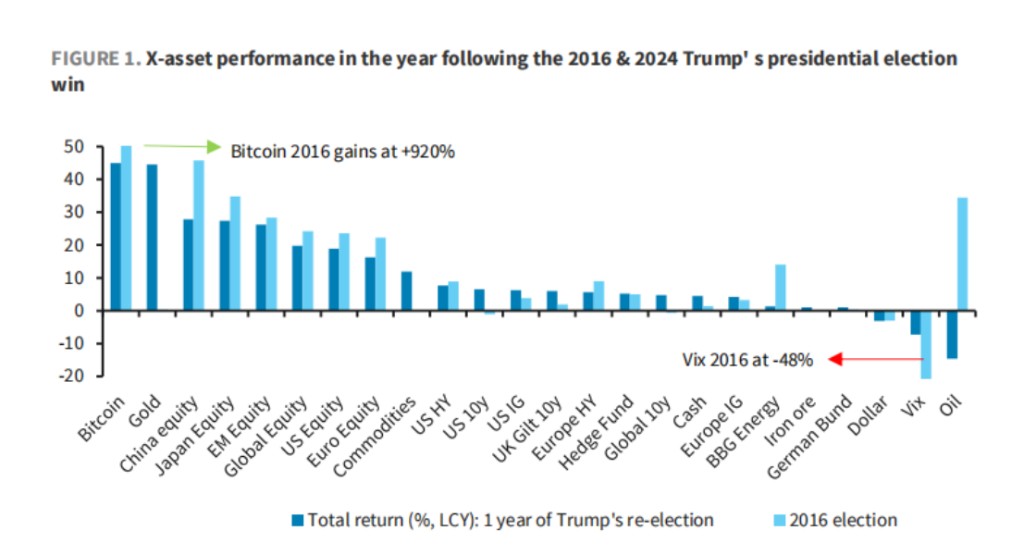
Barclays Bank believes that specifically, the market performance over the past 12 months shares similarities with 2017 (the first year of "Trump 1.0") including:
Bitcoin was the best-performing asset in both periods.
Stocks outperformed bonds.
In terms of regional performance, emerging markets/China and Japan's stock markets outperformed the U.S. stock market, while European stock markets lagged.
The dollar declined in both periods.
However, significant differences cannot be ignored:
Gold and Oil: This time, gold prices surged significantly, while they reacted mildly during the Trump 1.0 period; oil prices, on the other hand, fell sharply, contrasting with their status as one of the best-performing assets between 2016-17.
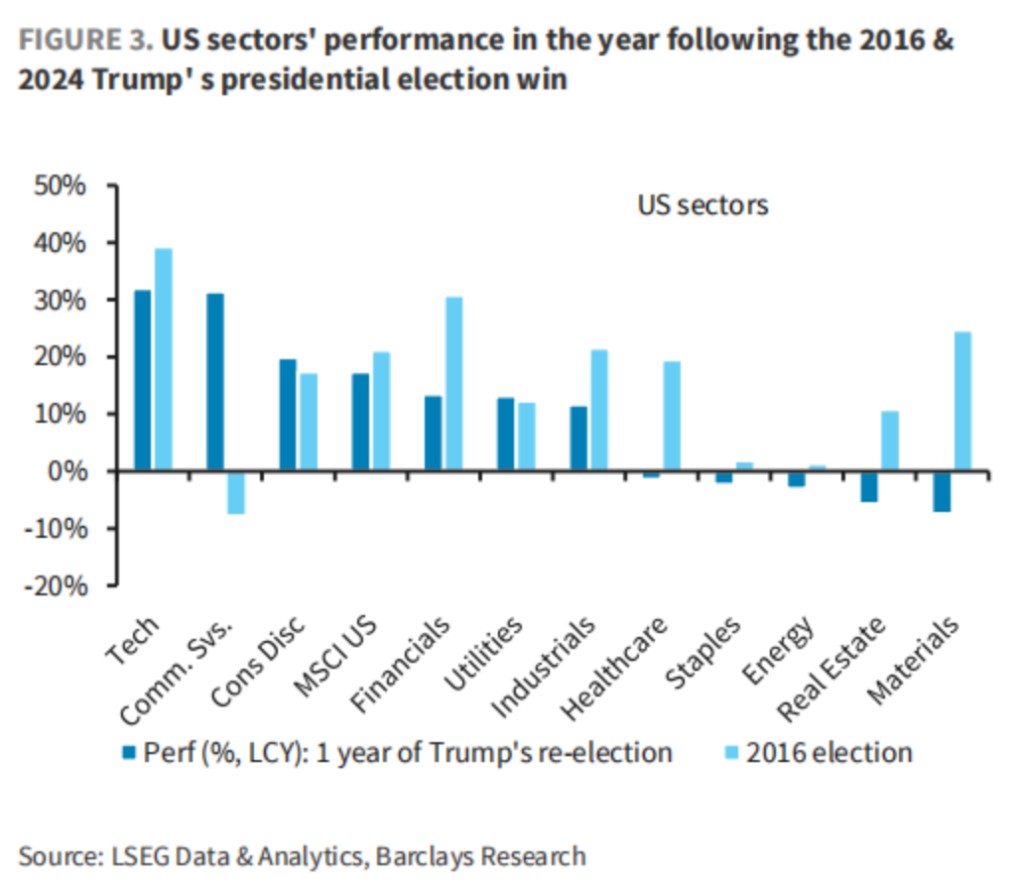
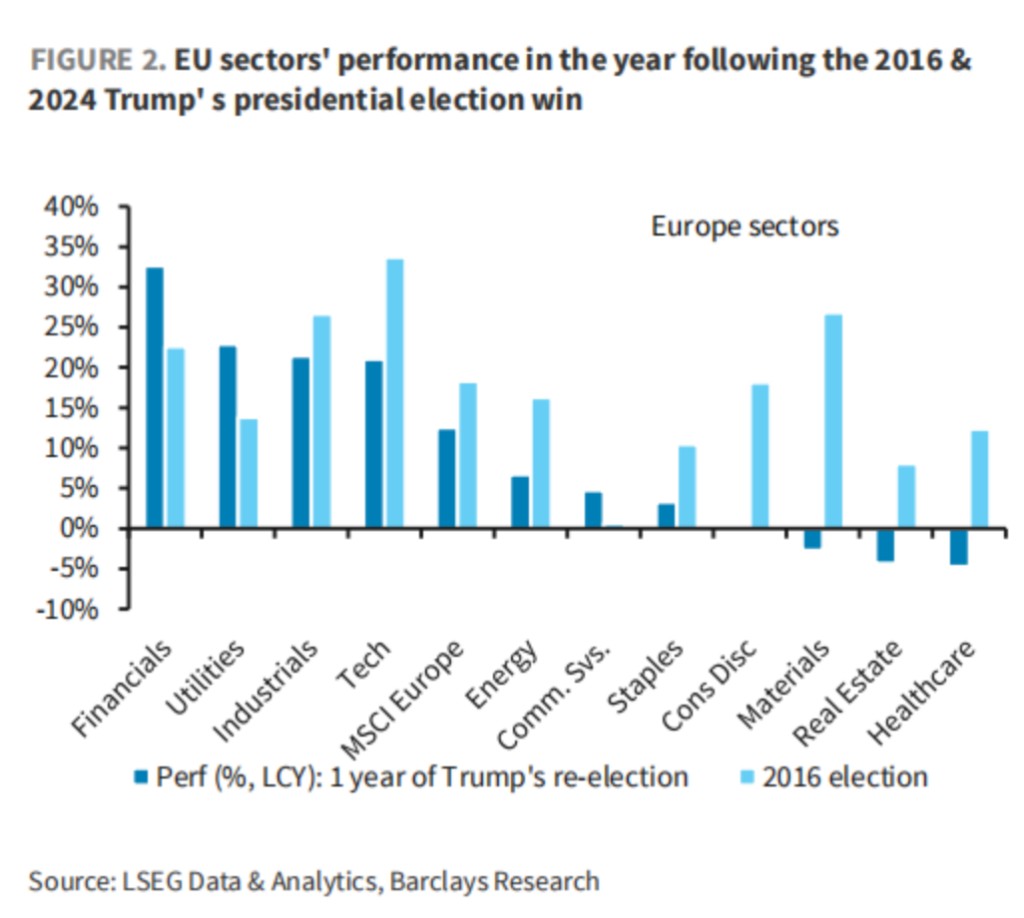
Sector Divergence: Unlike the broad gains across sectors during the 1.0 period, this time the performance of U.S. and European stock sectors is more severely differentiated. In the U.S., tech stocks once again took the lead, but materials, real estate, and energy sectors declined. In Europe, financial and utility sectors performed well, while healthcare, real estate, and materials sectors recorded declines.
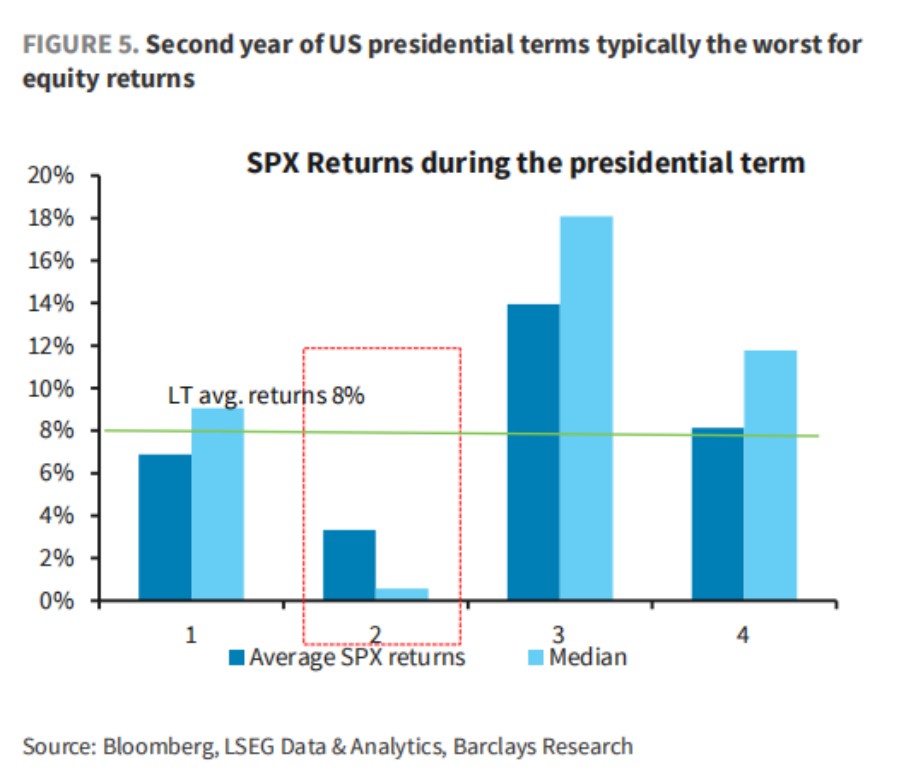
Historical Alarm: The Second Year of a Presidential Term is Usually the Worst Year for U.S. Stocks
Barclays Bank points out that despite encouraging returns in the first year, historical data sounds the alarm for the upcoming second year.
First, looking back at data since 1927, the second year of a U.S. presidential term (i.e., midterm election year) has the lowest average and median returns for the S&P 500 index.
Second, the experience of Trump's first term (2016-2020) also confirms this pattern. In the first year (2017), Bitcoin, emerging markets/Chinese stocks, and Japanese stocks performed excellently, but all turned to decline in the second year (2018). Meanwhile, market volatility surged sharply, with the VIX index soaring by 71% in 2018. At that time, as trade frictions became headline news, they continued to exert pressure on economic growth and ultimately led to a decline in the stock market.
Currently, the trajectory of global stock markets closely resembles that of Trump's 1.0 period. If history repeats itself, as the midterm elections in November 2026 approach, investors should prepare for potentially higher market volatility.