

Gold rebounds fiercely! Citigroup calls for $6,000, but faces pressure in 2026

Citigroup believes that under a bull market scenario, gold prices will rise to $6,000 by 2027. Its core logic is the huge mismatch between global wealth and the small physical gold market. The report estimates that if global household wealth increases its allocation to gold by just 1.5%, it would require 18 years of mineral supply to meet this demand. This imbalance can only be resolved through a surge in prices. Meanwhile, the main drivers of this round of increase are American investors, not central banks, with ETF inflows contributing to most of the global increment
After a brief pullback, gold is quickly regaining lost ground, with the current gold price having broken through the resistance level of $4,100 and is now testing the $4,200 mark.
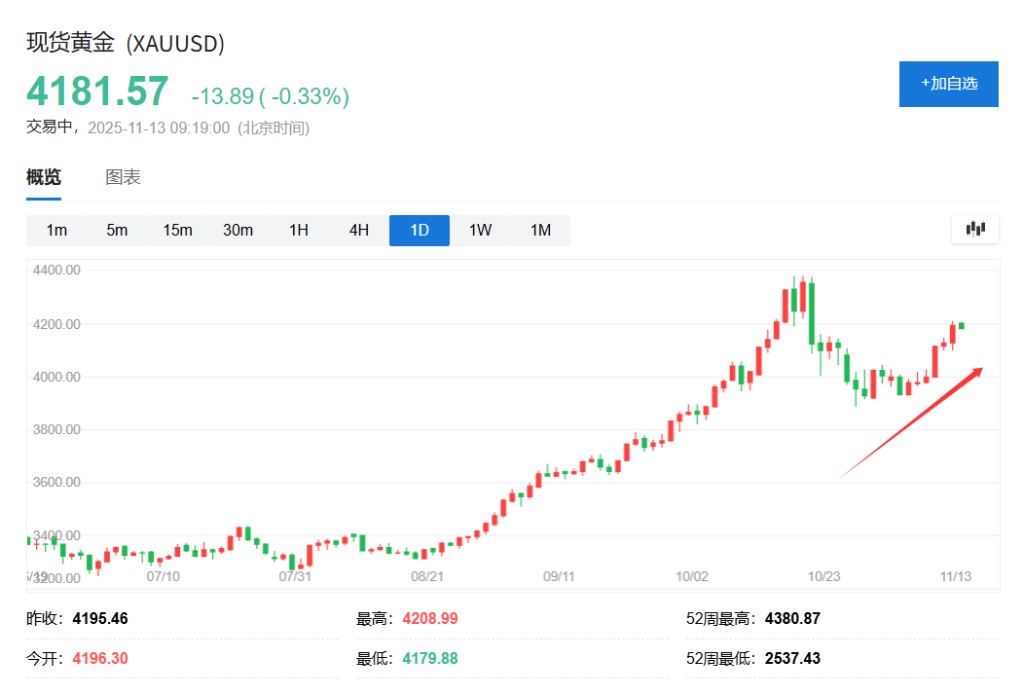
Although the gold price has rebounded about $300 from recent lows, a key momentum indicator—the Relative Strength Index (RSI)—shows that it has not yet entered the severely overbought territory, suggesting that upward momentum may still not be exhausted.
According to news from the Wind Trading Desk, Citigroup's latest gold outlook report released on November 10 predicts that under certain scenarios, there is a possibility for gold prices to surge to $6,000.
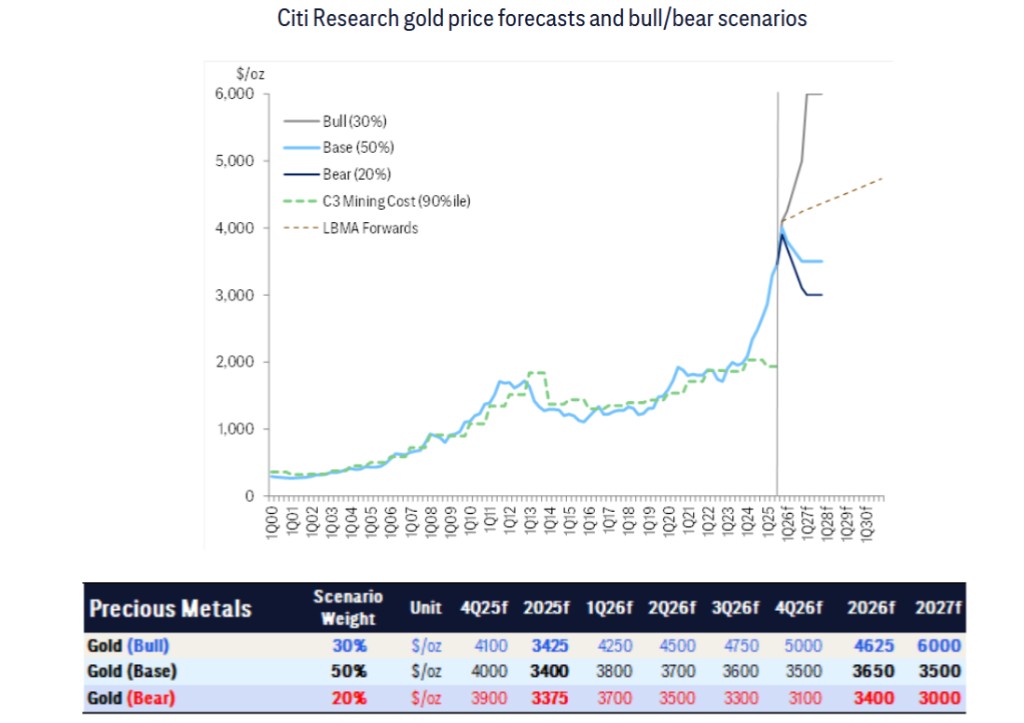
Its analysts state that in a bullish scenario with a 30% probability, gold prices could reach $6,000 per ounce by the end of 2027. This prediction is based on a large-scale global wealth reallocation, which the relatively small physical gold market will not be able to absorb, and will only be balanced through a price surge.
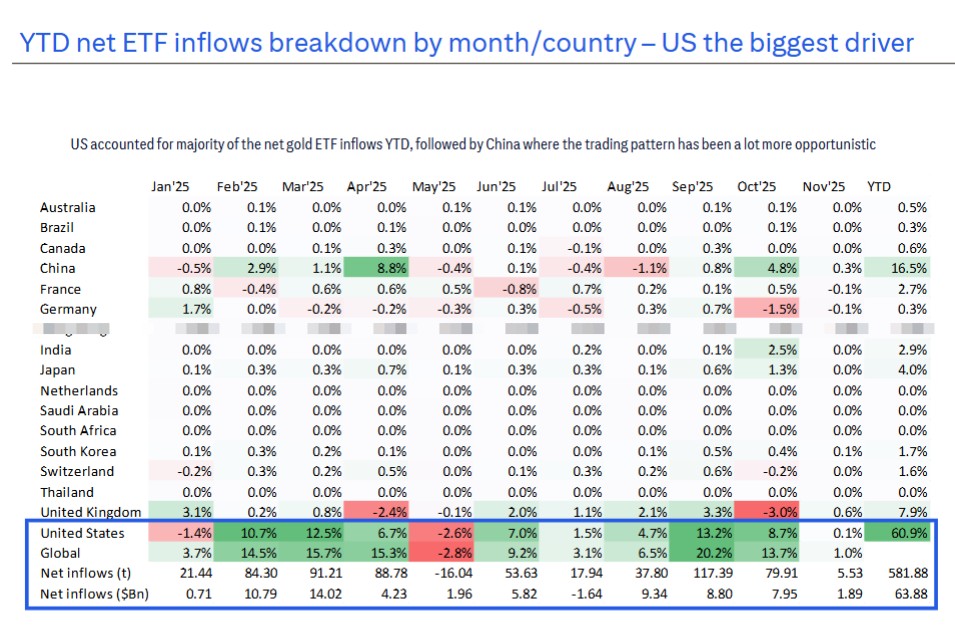
Citigroup believes that U.S. investors are the main force behind this round of gold price increases. Data shows that from 2025 to date, net inflows into gold ETFs in the U.S. market account for 60.9% of the global total.
However, the core viewpoint of this report is more cautious. Citigroup considers a scenario where gold prices "stumble lower" in 2026 as its baseline scenario, assigning it a 50% maximum probability. This prediction suggests that as the U.S. economic environment improves, gold prices will fall back to $3,650 per ounce.
$6,000 per ounce? A "bullish scenario" driven by wealth transfer
One striking point in the Citigroup report is the possibility of gold prices reaching $6,000 per ounce. According to the report's analysis, this is not its baseline prediction but rather a "bullish scenario" that could occur under specific conditions, with a probability of about 30%.
The core driving force of this scenario is the global reallocation of wealth. The report points out that the physical gold market is too small to absorb large-scale wealth transfers.
The report estimates that the average allocation of gold in global household wealth is currently about 3.5%. If this proportion were to increase by just 1.5 percentage points to 5.0%, the required amount of gold would be equivalent to 18 years of total global gold mine production.
"Clearly, the wealth transfer cannot be met by (supply), and prices need to play a role."
With limited supply, such enormous demand can only be met through a significant price increase, which could push gold prices to around $6,000 per ounce.
In this scenario, Citigroup predicts that gold prices will reach $5,000 per ounce by the end of 2026 and touch $6,000 per ounce by the end of 2027.
Baseline prediction: Gold prices may "slowly decline" to $3,650 in 2026
Despite the eye-catching target price of $6,000, Citigroup analysts clearly stated in their report that this is not their base case judgment. Instead, they believe that gold prices are more likely to weaken in 2026, giving it a 50% probability.
The report suggests that gold prices will experience a "grind lower" process in 2026. The main reason for their cautious stance on 2026 is that the cyclical environment of the U.S. economy is expected to move towards a "goldilocks" state.
It is anticipated that trade agreements from the Trump administration may lead to a decrease in tariffs, while capital expenditures and a strong stock market will drive U.S. economic growth, inflation risks will decrease, and concerns about the Federal Reserve's independence will weaken. In this environment, market risk appetite will rebound, favoring risk assets such as industrial metals and stocks, while the safe-haven appeal of gold will decline.
A key trigger will be a shift (increase) in U.S. growth sentiment and a decrease in real interest rates.
As a result, Citigroup has set a gold price target of $3,650 per ounce for 2026. Additionally, the report outlines a bear market scenario with a 20% probability, indicating that if geopolitical, fiscal, and cyclical concerns significantly ease, gold prices could fall back to $3,000 per ounce by the end of 2026 or in 2027.
Valuation Alert: Multiple Indicators at 50-Year Highs
For investors, a key risk point is the current valuation of gold. The Citigroup report indicates through multidimensional analysis that gold is "very expensive."
-
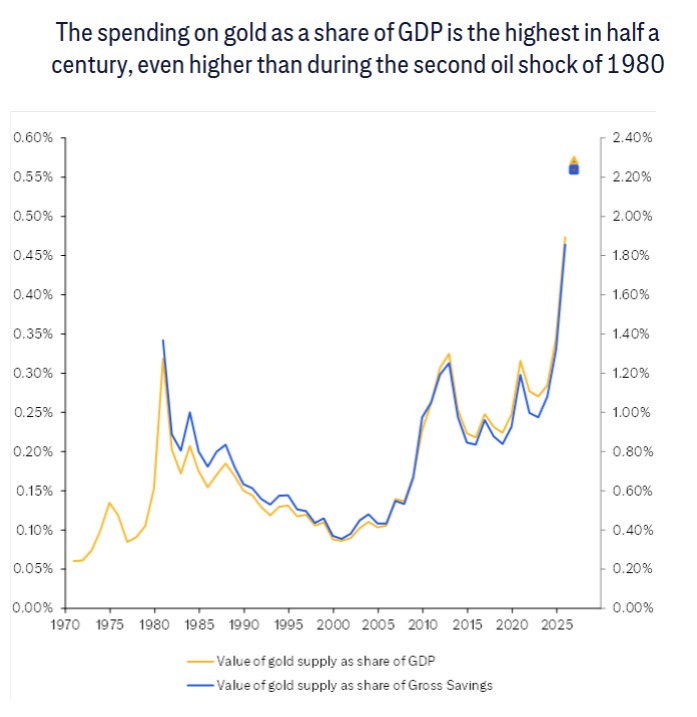
Disconnection from Production Costs: Current gold prices have far exceeded marginal production costs, with high-cost gold miners' profit margins reaching the highest levels in nearly half a century, even surpassing those during the second oil crisis in 1980.
-
Record Spending Ratio: At a price of $4,000 per ounce, global gold spending as a percentage of GDP has exceeded 0.55%, the highest level in 55 years.
-
Household Wealth Allocation at New Highs: The value of gold bars, coins, and jewelry held by global households now accounts for about 3.5% of their net wealth, the highest historical level.
-
High Central Bank Reserve Ratio: As gold prices rise, gold's share in global foreign exchange reserves has increased to nearly 35%, the highest level since the mid-1990s.
Who is Buying? U.S. Investors are the Main Drivers of Recent Increases
Citigroup's analysis shows that since 2025, gold prices have soared from $2,600 per ounce to $4,000 per ounce, driven primarily not by central bank purchases, which are widely focused on, but by investment demand outside of central banks.
In terms of 2025 dollar value, this net investment demand is running at an annualized rate exceeding $350 billion, setting a historical high Further breakdown of the data reveals that American investors are the main force behind this round of increases. According to the report, as of 2025, net inflows into gold ETFs in the U.S. account for 60.9% of the global total.
Citigroup believes that this strong investment demand largely reflects investors' efforts to hedge against the risks of economic slowdown that may be triggered by high U.S. interest rates and tariff policies.
Market Imbalance: Huge Physical "Gap" Supporting Prices
From a supply and demand perspective, Citigroup estimates that the current physical gold market is in a significant "gap" state, potentially exceeding 1,000 tons annually. This "gap" is more accurately described as a high-intensity "call on stockholders" from existing gold holders.
In other words, the current new purchasing demand far exceeds the supply of mined gold and recycled gold, and it must rely on the sale of gold held in inventory to meet this demand. As long as these holders (who have similar reasons for buying as new buyers, such as geopolitical concerns and sovereign debt worries) choose to continue holding, the market will remain tight, and prices can continue to rise until new buyers stop purchasing or holders are willing to sell.
However, the report also warns that at the high price of $4,000 per ounce, a decline in jewelry demand and an increase in recycled gold supply may somewhat alleviate this imbalance.
The above exciting content comes from [Chasing Wind Trading Platform](https://mp.weixin.qq.com/s/uua05g5qk-N2J7h91pyqxQ).
For more detailed interpretations, including real-time analysis and frontline research, please join the【 [Chasing Wind Trading Platform ▪ Annual Membership](https://wallstreetcn.com/shop/item/1000309)】
[](https://wallstreetcn.com/shop/item/1000309)