

Ethereum – THIS demand zone could decide ETH’s next breakout

Ethereum's price behavior around $3,150 is crucial for its next breakout. Buyers defend the demand zone between $3,097 and $3,200, with significant accumulation signaling confidence. Exchange reserves drop, indicating reduced selling pressure, while spot outflows suggest strategic dip buying. Top traders on Binance show strong long exposure, reinforcing bullish sentiment. A breakout from the descending channel is needed to confirm momentum, but current metrics favor a bullish continuation.
Key Takeaways
How does Ethereum’s behavior around $3,150 shape price movements?
Ethereum defends the accumulation zone while buyers increase absorption, Exchange Reserves fall, and spot outflows strengthen the bullish foundation.
What do derivatives and Long/Short behavior reveal about ETH?
Top traders increase long exposure as market structure aligns with rising confidence, reinforcing expectations for a potential breakout.
Ethereum [ETH] dropped to about $3,155 after a 10% daily decline, at press time. Yet, buyers continue defending the demand area between $3,097 and $3,200.
The cost-basis heatmap confirms that 2.53 million ETH were acquired near this region, which strengthens its role as a strategic accumulation pocket.
Buyers respond quickly when the market approaches this level because the zone holds strong historical significance. Moreover, the recent bounce attempts show that traders continue absorbing sell pressure.
This steady accumulation signals confidence among both large holders and retail participants. The chart structure reinforces the idea that ETH may prepare for a reaction if demand increases further.
Can Ethereum break free from the descending channel?
ETH continues moving inside a descending channel, yet the lower boundary aligns perfectly with the major accumulation zone.
Buyers treat this combination as a high-conviction setup because it merges structural support with strong historical demand.
Every approach toward the channel floor attracts quick buying, and this behavior strengthens the case for a potential reversal.
Moreover, the chart shows a projected breakout path that targets $3,659 first before higher levels.
The pattern carries weight because previous channel exits created strong rallies. The market now watches for increasing volume that could ignite a clean breakout attempt.
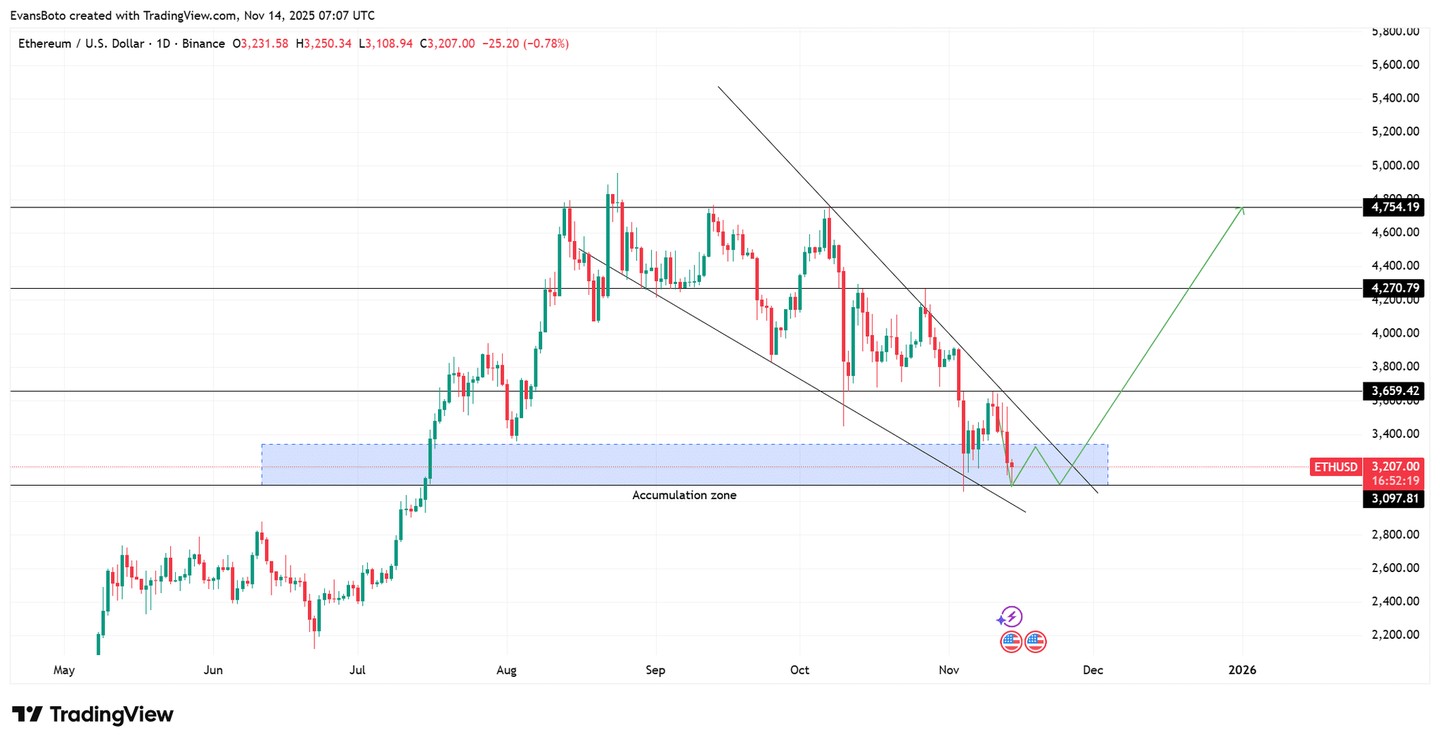
Source: TradingView
Exchange Reserves drop sharply!
Exchange Reserve USD shows a notable 9.75% decline, as of writing, which reveals a clear reduction in available supply on trading platforms.
Traders remove coins from exchanges when they expect higher prices because external wallets signal stronger conviction. This trend aligns with ETH’s continued defense of the $3,150 zone because lower reserves reduce immediate selling impact.
Moreover, shrinking supply frequently enhances the effect of buyer demand. The current downturn in reserves reflects a market that prefers holding instead of distributing.
This type of behavior often appears during accumulation phases. The alignment between reserves and demand strengthens the bullish narrative.
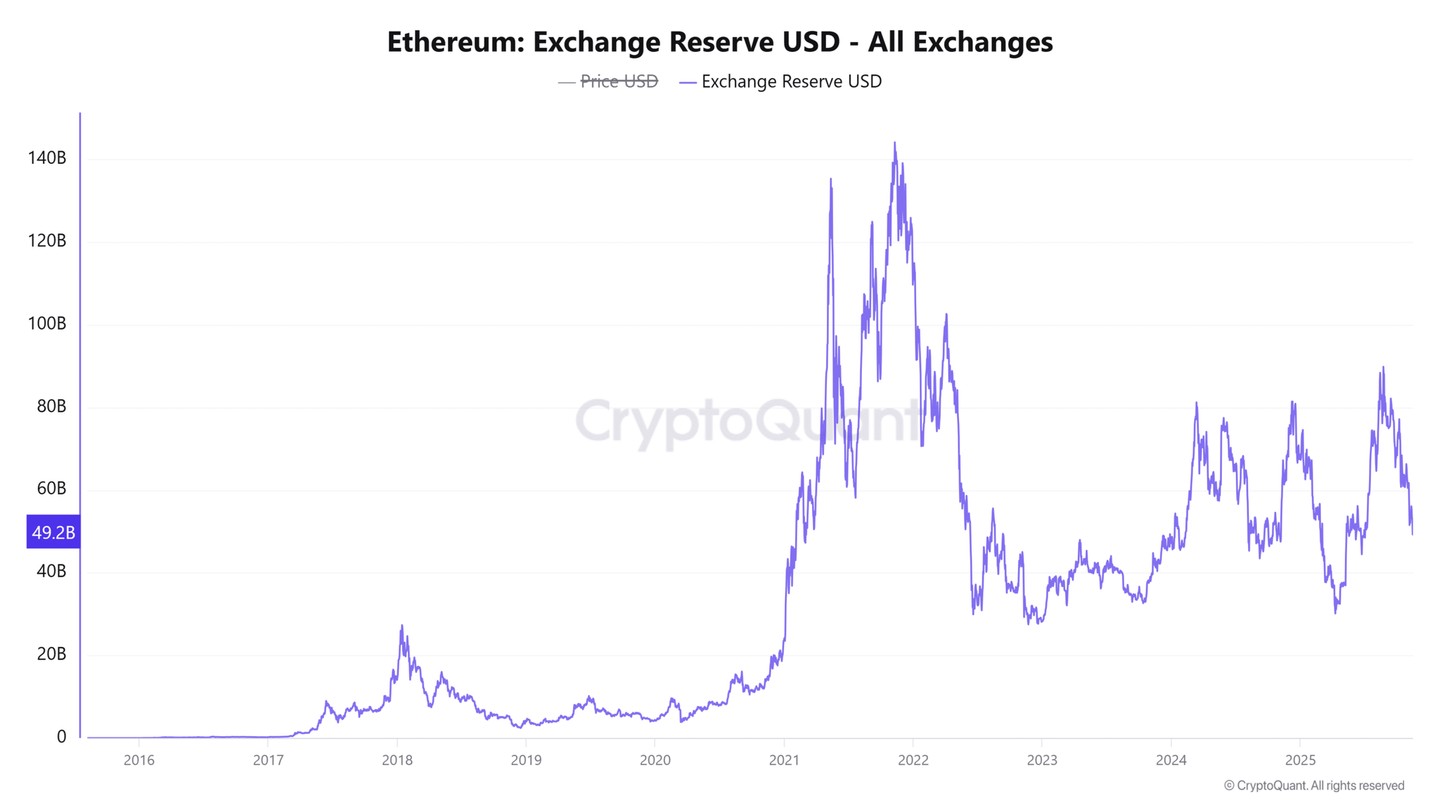
Source: CryptoQuant
Massive spot outflows amplify the bullish narrative
Spot market flows indicate sustained accumulation pressure, with ETH registering a significant $50.91 million outflow in the latest session.
This type of withdrawal often signals expectations of a price rebound, reinforcing the narrative of strategic dip buying among traders.
Additionally, recent charts show a series of consistent red bars, suggesting that selling momentum is weakening. This outflow pattern closely resembles past market phases that preceded strong recoveries.
Additionally, the timing aligns perfectly with the broader decline in exchange reserves. This creates a unified signal across on-chain metrics and price structure that favors accumulation rather than distribution.
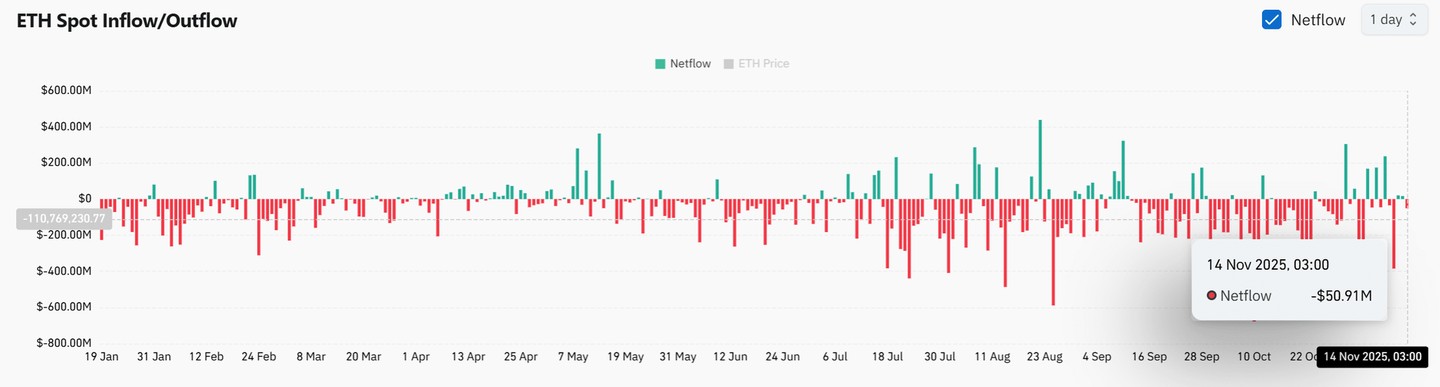
Source: CoinGlass
Top traders continue leaning aggressively long on Binance
Binance top-trader positioning reveals 73.16% long exposure versus 26.84% short exposure, at the time of writing. This signals strong bullish sentiment among experienced traders.
This trend remains important because top traders react quickly to structural shifts. They increase long exposure when they anticipate a rebound from critical demand zones.
Moreover, the rising Long/Short Ratio aligns with stronger spot outflows and shrinking Exchange Reserves, creating a cohesive narrative.
These traders often position early ahead of breakouts, and their conviction strengthens the argument for an upside attempt. Market participants now watch for confirmation that validates this directional bias.
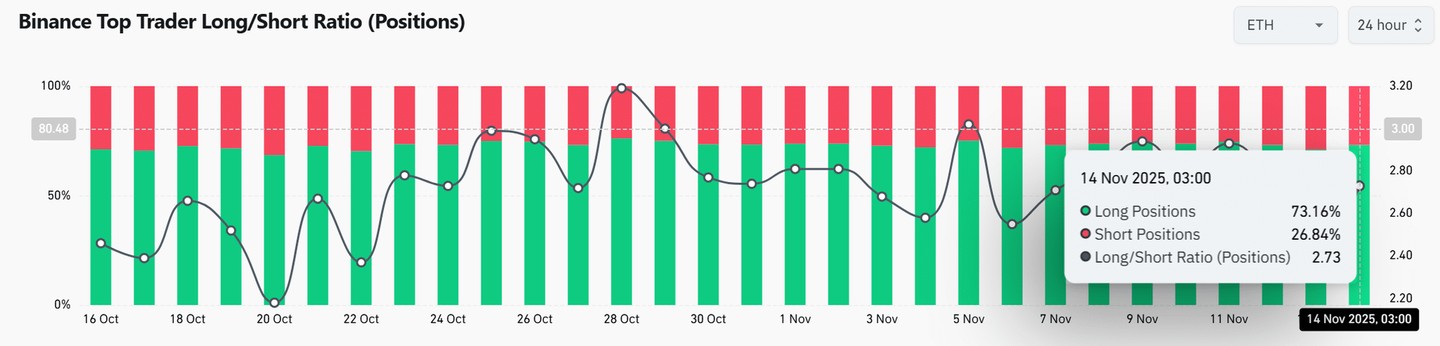
Source: CoinGlass
To conclude, Ethereum shows strong demand across several major metrics, including accumulation, outflows, Exchange Reserves, and derivatives positioning.
Buyers continue defending the $3,150 zone, while experienced traders increase long exposure.
These signals strengthen the argument for a possible rebound if buying continues. ETH still needs a clean breakout from the descending channel to confirm momentum.
However, the current structure favors bullish continuation, and the charts highlight a clear foundation for upward pressure.
