

This year's effective indicator: Which industries have orders that are continuously improving?

In the first three quarters of this year, despite the average performance of traditional economic sectors, the A-shares have achieved performance stabilization and improvement relying on certain manufacturing industries, especially technology/overseas-driven advanced manufacturing. Contract liabilities, as an indicator of order improvement, are positively correlated with macroeconomic performance and stock price performance. The growth rate of contract liabilities in the wind power equipment and battery industries has significantly increased in Q4 2024 to Q1 2025, reflecting marginal changes in industry demand
In the first three quarters of this year, although our perception of traditional economic sectors (domestic consumption, real estate cycle, service industry) is generally average, the A-share market has overall relied on certain manufacturing industries, especially advanced manufacturing driven by technology/overseas demand, to achieve stabilization and improvement in performance from a total volume perspective. This change is hard-won, corresponding to the market capitalization weight, performance, and public fund holdings of A-share industries this year, all of which subtly reflect the economic transformation.
- The improvement in ROE's equity multiplier comes from the continuous increase in "contract liabilities," which can represent orders.
Among them, the ROE of A-shares has remained stable at the bottom this year, with contract liabilities - interest-free liabilities - equity multiplier being the support in the DuPont three-factor model. In financial data, we have observed a continuously improving indicator this year, represented by "contract liabilities + advance receipts" to signify corporate "orders." We have conducted industry screenings after the first and second quarterly reports.
Especially under the requirements of the new accounting standards, the scale of "contract liabilities" accounts for about 1/10 of the revenue scale, which can be seen as a thermometer for demand changes in certain industries.
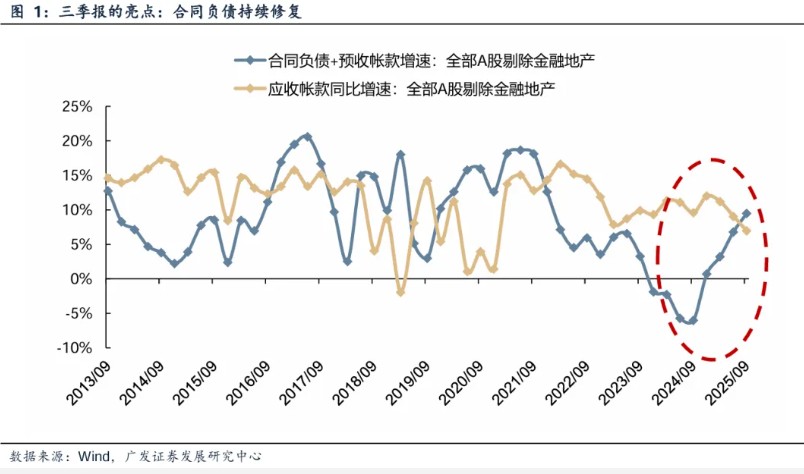
From a total volume perspective, the growth rate of "contract liabilities" basically coincides with the turning points of the macro economy's upturn/downturn and has a positive correlation with "revenue growth rate" and "stock price performance." The peak of the growth rate of A-share "contract liabilities" in this round was in Q1 2021, and the low point was in Q3 2024, which basically aligns with the economic trend and can be understood as a reflection of the activity level of corporate production and operations.
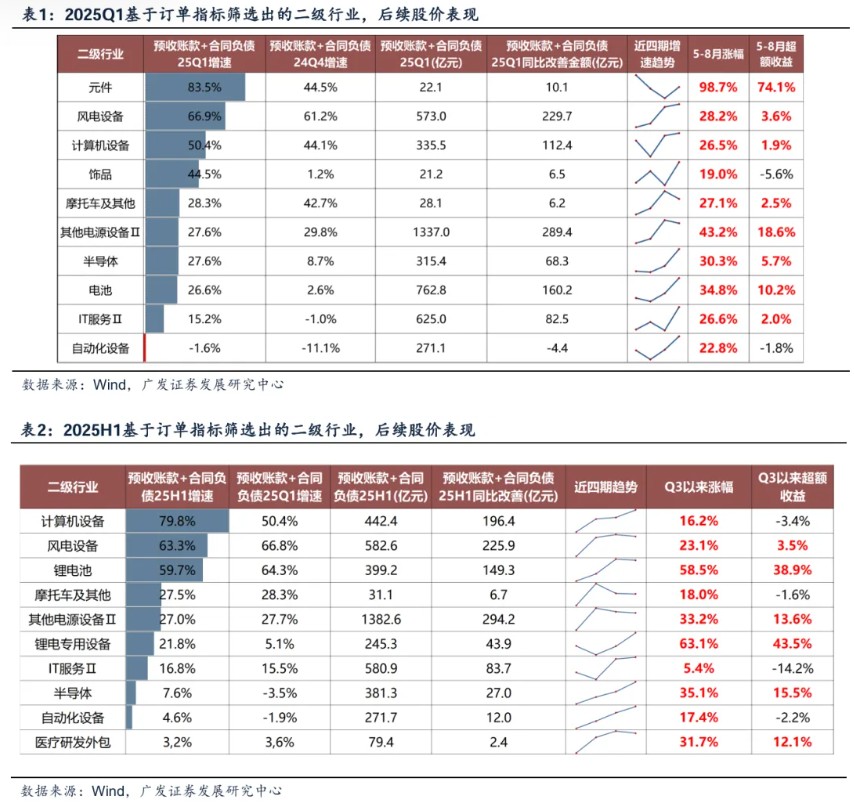
2. In this year's first and second quarterly reports, manufacturing industries with a significant increase in contract liabilities have basically achieved good excess returns.
From a structural perspective, in the first quarter, we screened industries based on continuous high growth in orders, representing components (PCB), wind power equipment, and computer equipment (servers). In the mid-year report, we similarly screened lithium batteries, power equipment, and lithium equipment, among others.
These industries have achieved absolute increases and excess returns in the subsequent market performance this year, confirming the marginal changes occurring in the industry fundamentals, especially on the demand side.
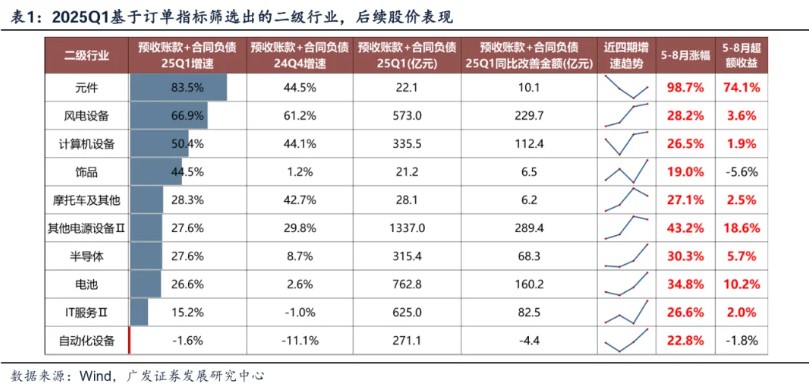
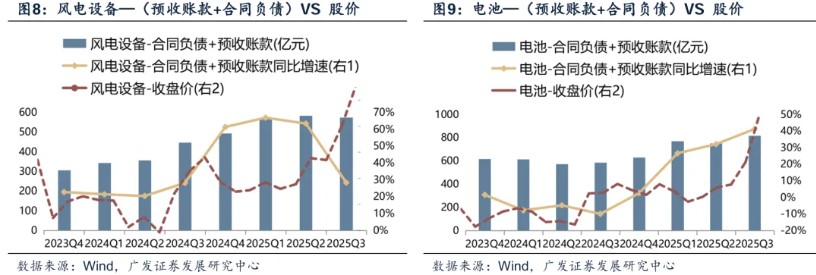
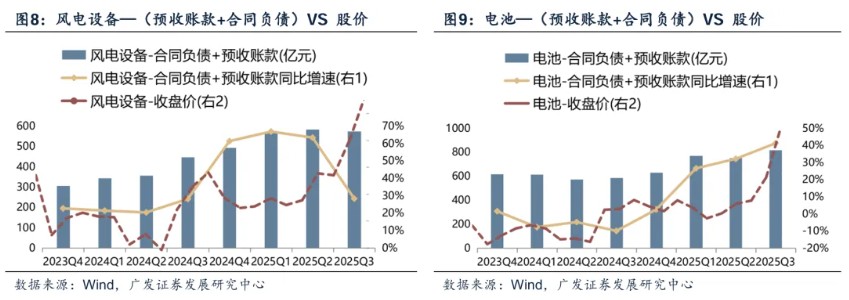
 Taking the wind power equipment and battery industries as examples, where the growth rate of contract liabilities has continuously improved since the beginning of this year, these two industries have shown a significant increase in contract liabilities around Q4 2024 to Q1 2025, and have maintained a high level. As shown in the figure below, the turning point of the growth rate of contract liabilities is basically synchronized with the turning point of stock price performance.
III. Continuing this line of thought, which industries contributed to the continued improvement of order growth in the A-share non-financial sector in the third quarter report?
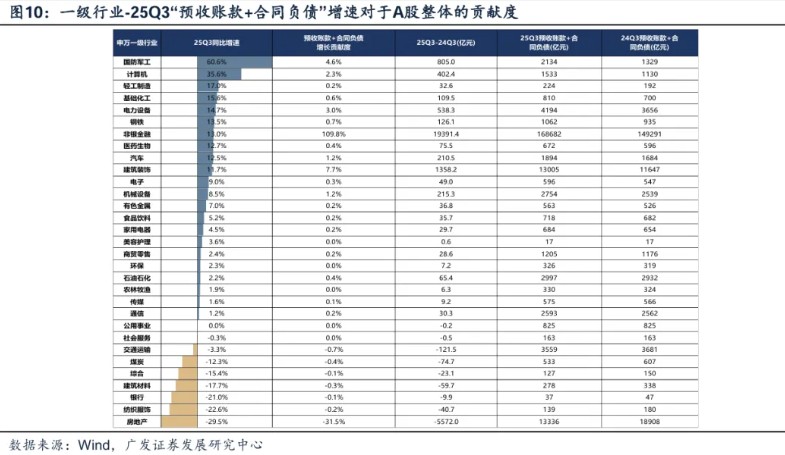
The year-on-year growth rate of contract liabilities in the A-share market has significantly improved for four consecutive quarters, among which the primary industries with high year-on-year growth rates and high contribution in the third quarter report are: defense and military industry, computer, light industry manufacturing, basic chemicals, power equipment, steel, pharmaceuticals, and automobiles.
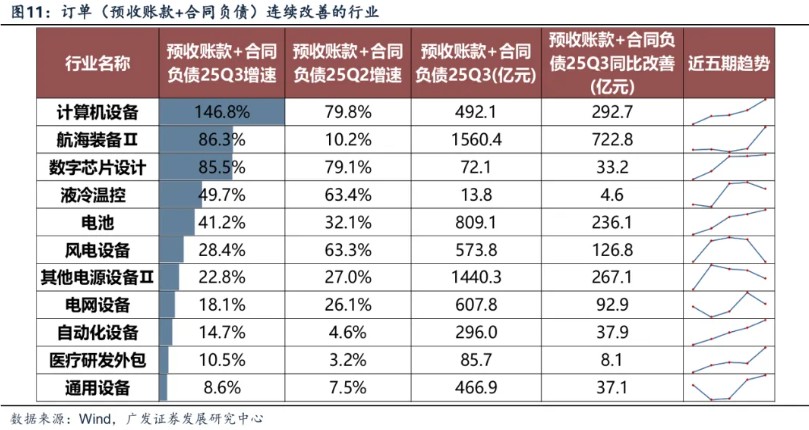
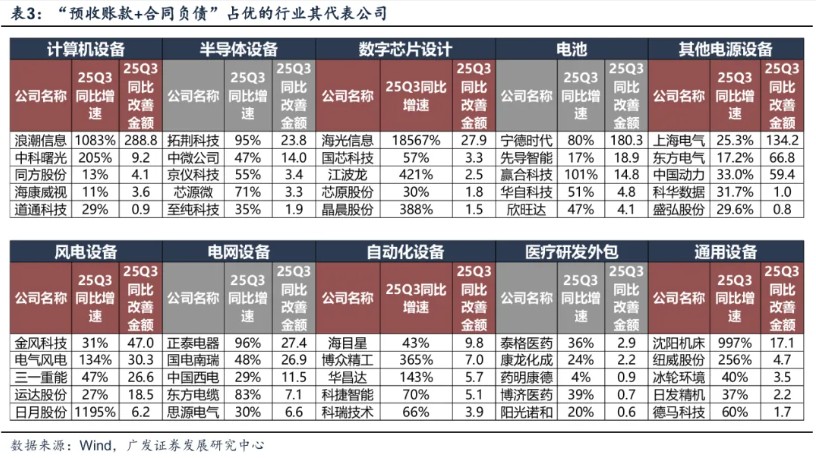
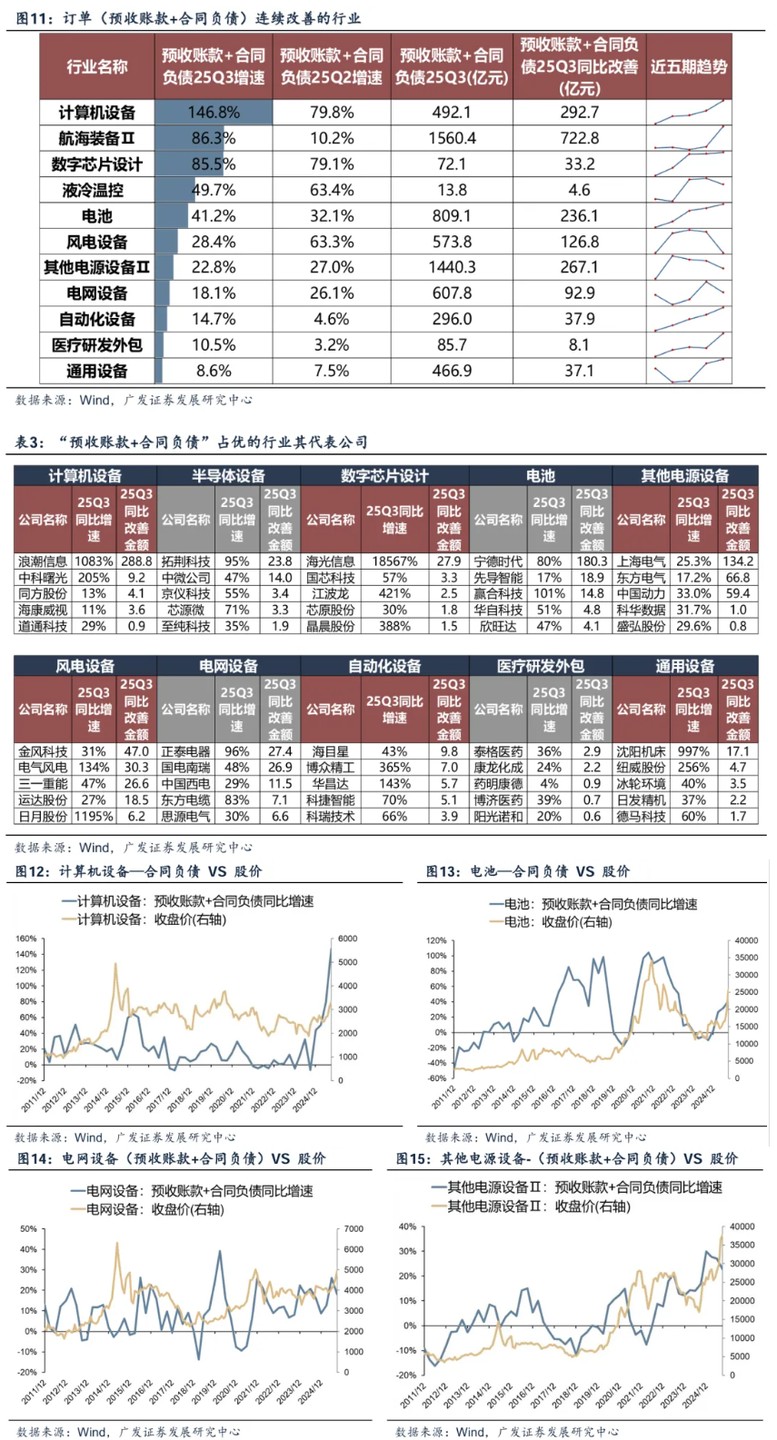
We further combined industry bottom-up verification to screen industries that have continuously improved order growth in recent quarters, with high year-on-year growth in order growth in Q3 2025 and good company verification conditions. Based on the experience of previous quarters, the confidence in demand improvement for these industries from the bottom up is relatively high, and we have also organized representative companies as shown in the table below:
Computer equipment, shipbuilding, digital chip design, liquid cooling temperature control, batteries, wind power equipment, semiconductor equipment, other power supply equipment, grid equipment, automation equipment, CXO, general equipment, etc.
IV. The short-term market is in a phase of "anti-fundamentals" and "long-term speculation," but at the end of the year and the beginning of the next year, the correlation between fundamentals and stock prices will increase again.
In the short term, the market characteristics in November are "anti-fundamentals" and "long-term speculation," with a reduced correlation between stock price performance and fundamentals.
However, based on statistical data, we judge that by mid to late December, at the latest by early next year, the correlation between market pricing and prosperity factors will increase again; at that time, the sectors with continuously improving orders and signs of demand recovery will still be a valuable clue to track in the industry comparison.

Report Body
I. Topic of this issue: Which industries have orders that are continuously improving? (1) A-share Q3 report ROE remains stable at the bottom, with "contract liabilities" driving the leverage ratio to stabilize and rebound from the DuPont factors
In our in-depth analysis report on the Q3 report, we mentioned that ROE has remained stable at around 6.6% for four consecutive quarters. Among the three DuPont factors, the leverage ratio has ended its continuous downward trend from 2020 to 2024 and has turned to rebound in 2025, with interest-free liabilities driven by orders (contract liabilities) being the main reason for the upward trend.
The asset-liability ratio of non-financial A-shares has ended the continuous decline cycle from 2020 to 2024, indicating a positive shift in corporate confidence regarding future operations. The interest-free liability ratio driven by contract liabilities is the main reason for the increase. In terms of debt structure, both the interest-bearing debt ratio and the interest-free debt ratio have stabilized, and the order indicators reflected by [prepayments + contract liabilities] have rebounded for four consecutive quarters, while the pressure on accounts receivable has eased, collectively pointing to an improving trend in operating cash flow.

[Prepayments + Contract Liabilities] can approximately represent the company's [order] situation, which is a component of the company's "current liabilities."
Among them, "prepayments" may involve payments made before the contract is signed (such as earnest money), while "contract liabilities" require the establishment of a contract (performance obligations). The combination of these two indicators can be understood as the advance payments received by the company for order intentions, so their amount and trend changes can partially explain the scale of goods or services the company will deliver in the future, serving as a tracking indicator for orders.
Contract liabilities are a concept introduced by the new revenue standard (CAS 14) in 2017, referring to the obligations of a company to transfer goods or services due to amounts received or receivable from customers. Its characteristics include: 1. Relevance of performance obligations: must be based on signed contracts with clear performance obligations (such as delivery of goods, provision of services); 2. Recognition conditions: not contingent on actual receipt of payment, as long as there are performance obligations in the contract and the company has the right to receive consideration, it can be recognized.
In Q3 2025, the amount of contract liabilities + prepayments for non-financial A-shares was 5.8 trillion, accounting for about 9.2% of the revenue scale (TTM revenue scale of 62.8 trillion). Among them, under the requirements of the new accounting standards, contract liabilities have taken a major position (5.7 trillion), while prepayments are only 136.9 billion.
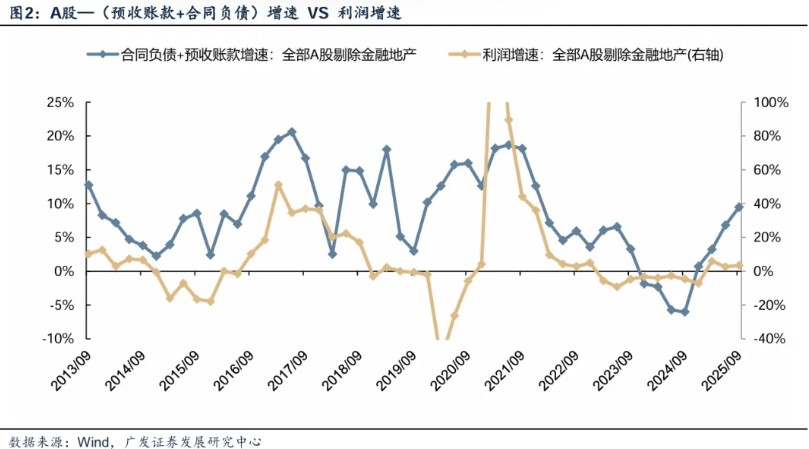
As shown in the figure below, the year-on-year growth rate of [prepayments + contract liabilities] in the medium term has certain indicative significance for the overall profit growth rate of A-shares.
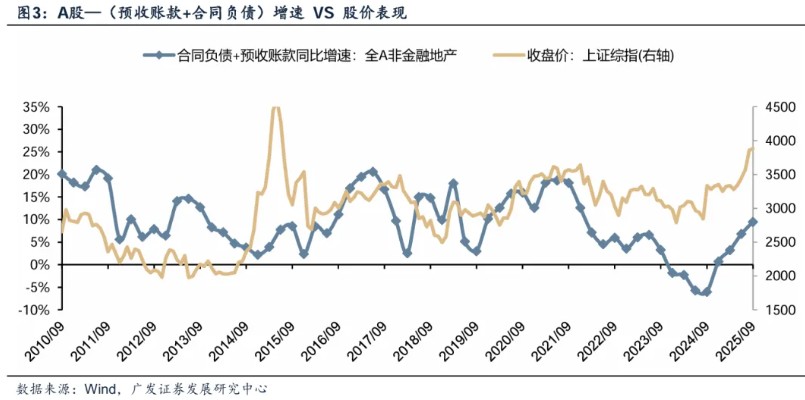
Furthermore, since the medium-term trend of this indicator represents changes in demand, it also provides guidance for the medium-term trend of stock prices. Q1 2021 was the peak of this round of prosperity, corresponding to the peak of the index; Q3 2024 is the low point of this round of prosperity, corresponding to the low point of the index.
 Some manufacturing industries, due to the cyclical volatility of "contract liabilities," also point to cyclical changes on the demand side.
As seen in the chart below, the year-on-year growth rate of "advance receipts + contract liabilities" in some typical manufacturing sectors has a positive correlation with "revenue growth," "profit growth," and "stock price performance."
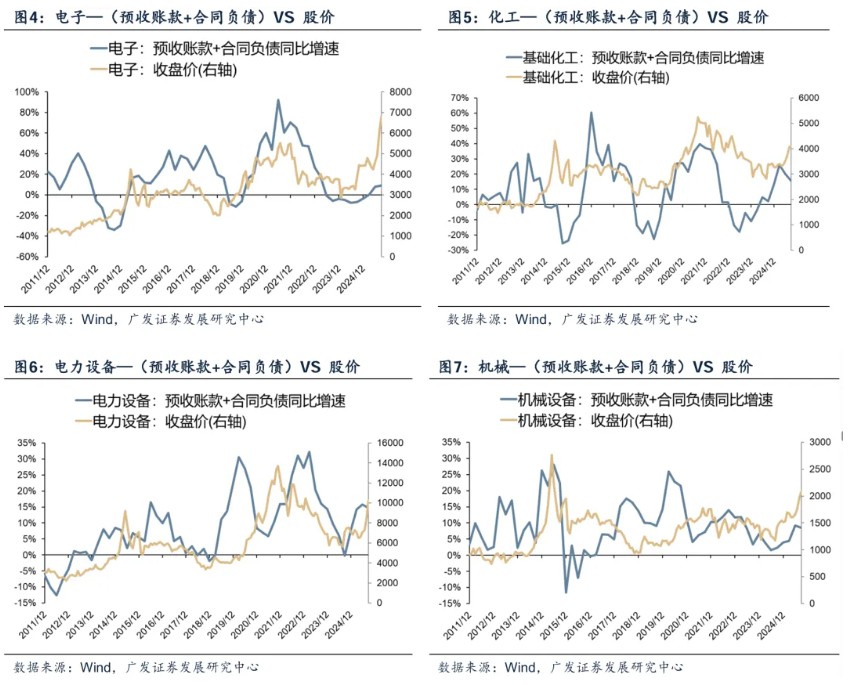
Therefore, this indicator can effectively reflect the situation of signed orders and advance payments, serving as an important leading signal for observing the upcoming upward trend in industry prosperity.
In the summary of the first quarter and mid-year reports this year, we used the forward-looking financial indicator "contract liabilities" to identify sub-sectors in the A-share industry where demand is recovering first and order certainty is high, with actual verification proving its effectiveness.
In the first quarter, we selected representative industries such as components (PCB), wind power equipment, and computer equipment (servers) based on continuous high growth in orders. Similarly, in the mid-year report, we identified lithium batteries, power equipment, and lithium equipment, most of which achieved absolute increases and excess returns in subsequent market performance.
Taking the wind power equipment and battery industries, which were selected in both the first quarter and mid-year reports, as examples, the total amount of "contract liabilities + advance receipts" in these two manufacturing sectors saw a year-on-year increase starting from the first quarter of 2025 and has continued to remain high since then.
Based on this data, it can be inferred that both industries may have experienced a surge in new contracts and an increase in advance payment intentions at that time, indicating the early stages of demand growth. Combined with bottom-up verification at the company level, further validation of demand-side improvement can be captured, which may correspond to strong stock price performance in the second half of this year.
The chart below shows a high degree of correlation between the turning point of industry stock prices this year and the turning point of order volume.
(2) Which industries contributed to the improvement in A-share orders in the third quarter?
The year-on-year growth rate of A-share "advance receipts + contract liabilities" continued to improve significantly in the third quarter report, with the primary industries contributing to high year-on-year growth and growth contribution being: defense and military industry, computers, light manufacturing, basic chemicals, power equipment, steel, pharmaceuticals, and automobiles.

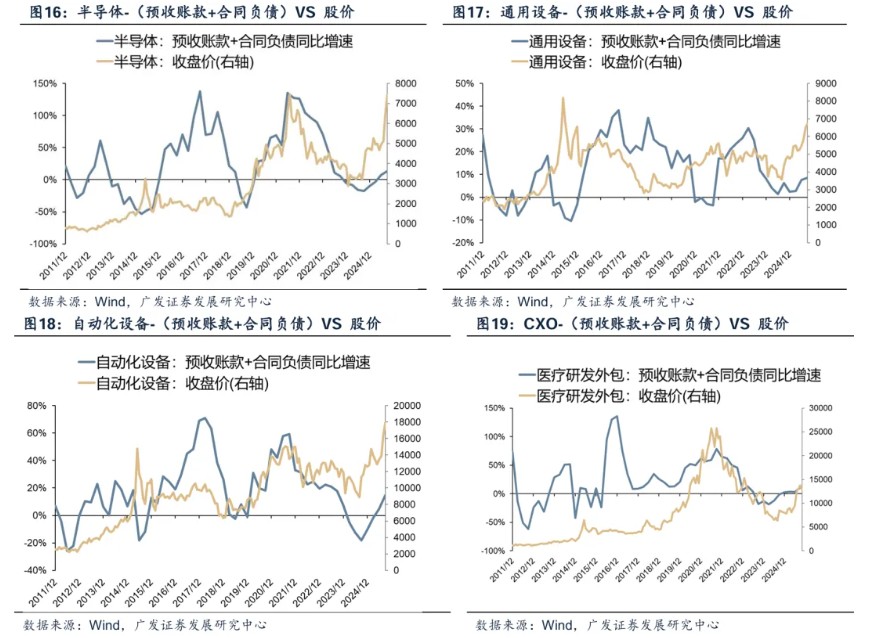
We further examined the third quarter report, screening industries with continuous improvement in order growth over recent quarters and high year-on-year growth in order growth for Q3 2025 as shown in the table below: computer equipment, shipbuilding, digital chip design, liquid cooling temperature control, batteries, wind power equipment, semiconductor equipment, other power equipment, grid equipment, automation equipment, medical R&D outsourcing, general equipment, etc Although the short-term market characteristics in November are "anti-fundamental" and "forward speculation," based on data statistics, we judge that by mid to late December, at the latest by early next year, the correlation between market pricing and economic indicators will increase again; at that time, the sectors with continuous improvement in orders and signs of demand-side recovery will still be a valuable clue to track in the industry comparison.
For detailed industry【stock price VS contract liabilities】charts, please refer to the text below, and the representative companies are also provided for reference.
The authors of this article are Liu Chenming/Zheng Kai/Chen Zhenwei from GF Strategy, source: GF Strategy, original title: "【GF Strategy】An Effective Indicator This Year: Which Industries Have Orders Continuously Improving?"
Risk Warning and Disclaimer
The market has risks, and investment should be cautious. This article does not constitute personal investment advice and does not consider individual users' specific investment goals, financial conditions, or needs. Users should consider whether any opinions, views, or conclusions in this article are suitable for their specific circumstances. Investment based on this is at their own risk
