

The end of AI is electricity

Global electricity demand has increased due to factors such as the development of AI and the recovery of the manufacturing industry, leading to rising electricity prices. Since 1980, there have been multiple periods of electricity shortages, and currently, the electricity consumption growth rate in the United States, Japan, and South Korea exceeds the GDP growth rate. The electricity demand in the United States mainly comes from AI data centers, with electricity investment expected to reach $44 billion by 2028. China's electricity supply is relatively sufficient, which is conducive to asset returns and capacity value reassessment
Abstract
1 Global "Power Shortage History" Since 1980
The rapid development of AI in the United States has exacerbated the phenomenon of "power shortage," leading to a significant increase in electricity prices. The market's focus has shifted from AI to the broader "general AI" sector represented by electricity. We tend to believe that this will be a global power shortage cycle, with more extensive and lasting impacts, as the sources of electricity demand are not limited to AI; the recovery of global manufacturing activities, infrastructure construction in emerging markets/developing countries, and accelerated industrialization processes will also drive more electricity demand. Moreover, global power shortages are not a new occurrence; a review of the global "power shortage history" since 1980 reveals five phases: 1986-1989, 1992-1995, 2002-2005, 2009-2011, and 2020-2022.
During these phases, the global electricity consumption growth rate and industrial electricity prices in major countries have both risen, with the electricity consumption growth rate often exceeding the actual GDP growth rate in most years. In periods of global power shortages, investments related to electricity and the power grid typically see significant increases, and the export share of major manufacturing countries tends to rise as well. Currently, the electricity consumption growth rates in the U.S., Japan, and South Korea are trending to outpace actual GDP growth. China, relatively unaffected by power shortages, lays the foundation for the return of physical assets and the revaluation of production capacity.
2 Analysis of the Current Situation and Future Outlook of the Global Power Shortage
We have analyzed the power supply and demand situation in different regions and found that the power shortage issues faced by different regions are not the same:
(1) For the United States, the new demand primarily comes from AI data centers (with an additional electricity demand of 89GW by 2028); at the power system level, the U.S. faces insufficient investment on both the supply side and the grid side. According to estimates from the new energy industry, the main contribution to installed capacity growth in the U.S. over the next three years will come from photovoltaics and gas power, but the fastest-growing installed capacity will be from SOFC, while the demand for energy storage is expected to grow more than 14 times (from 2025 to 2028). We estimate that total investment in electricity and the power grid in the U.S. could reach at least $440 billion by 2028, accounting for about 1.5% of nominal GDP in 2024.
Additionally, there is a new perspective worth noting: many cryptocurrency mining operations engaged in Bitcoin mining are beginning to transition to AI cloud services and data center businesses. However, if the price of Bitcoin falls below $56,645, these mining operations may consider a full transition, which could bring about an additional 18GW of electricity supply, potentially alleviating the power shortage.
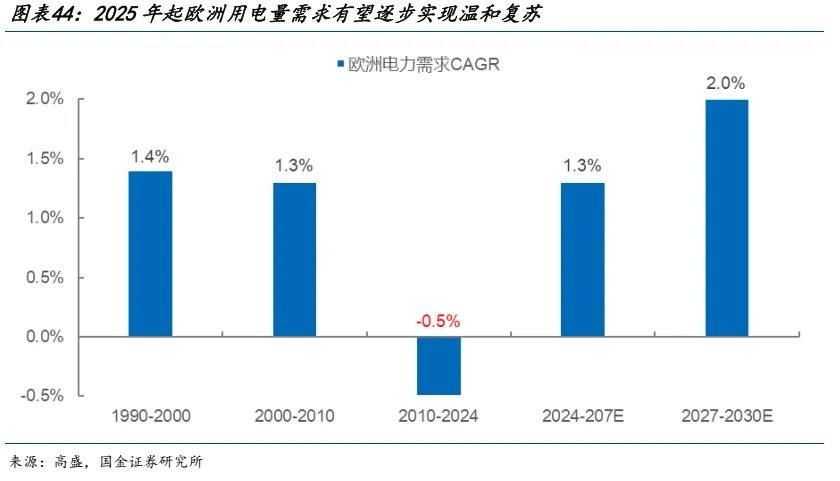
(2) For Europe, the development of emerging industries and the trend of electrification are jointly increasing electricity demand. According to estimates from the new energy industry, Europe's electricity demand CAGR from 2024 to 2027 is expected to be 1.3%, accelerating to a CAGR of 2.0% from 2027 to 2030. However, Europe's power system's heavy reliance on renewable energy remains an unstable factor, making the demand for energy storage installations the fastest-growing: by 2028, energy storage installations are expected to grow more than tenfold compared to 2025 (3) For emerging countries, in recent years, the trend of "resource nationalism" has resurfaced, and the demand for infrastructure construction among major economies is becoming increasingly urgent. Looking back at the industrialization processes of major countries since the 1960s, whether it is Japan's post-war economic reconstruction or the industrialization of economies such as Singapore, South Korea, and China, during the phase when the value added of their manufacturing industries significantly increased as a proportion of GDP, the growth rate of electricity consumption in these countries consistently outpaced that of the rest of the world, creating a noticeable "electricity growth gap."
(4) For China, currently, due to the anti-involution trend, there is a significant surplus in domestic electricity supply compared to the electricity demand driven by economic growth. Since 2025, electricity consumption has not kept pace with actual GDP, marking a departure from the electricity shortage situation seen in the first half of 2022-2024.
According to estimates, future electricity supply will be sufficient to support domestic economic development needs, and there is considerable room for electricity exports: that is, monetizing the surplus energy with strong price competitiveness globally through the trade of related goods as electricity carriers, forming an important support for the domestic economy. This also aligns with the historical pattern where major manufacturing countries increased their global market share during periods of global "electricity shortage" through exports.
3 Investment Opportunities from Global Electricity Shortages: New Demand vs. Old Supply
Drawing parallels with the new energy industry chain from 2019 to 2021, China's energy/manufacturing advantages will significantly benefit from the growth in global electricity demand. In 2021, under the backdrop of the "dual carbon" energy transition policy, new energy became the strongest industrial trend, bringing a large amount of investment. However, due to the instability of wind and solar power generation and the mismatch in energy storage, the stability of the electricity system was compromised: on one hand, this increased the demand for traditional energy; on the other hand, electricity shortages caused significant disruptions to the production activities of many upstream and midstream industries, some of which also benefited from the demand brought by downstream new energy development.
Looking ahead, global electricity demand is expected to grow rapidly, but China holds an absolute advantage in energy supply and pricing globally. In the future, there will be a large increase in demand for electricity and manufacturing/products based on electricity. Based on the above logic, it is recommended to focus on: (1) The growth in demand for related equipment brought about by the construction and improvement of the electricity system: energy storage/electricity equipment/gas turbines/SOFC/photovoltaics/wind power, etc. (2) The increase in physical consumption resulting from the construction of the electricity system: upstream resources (copper, aluminum, lithium), steel, etc. (3) Relevant raw materials that are in short supply due to rising downstream new energy demand and tight links in the industrial chain: separators/lithium iron phosphate anodes/cathodes/lithium hexafluorophosphate, etc. (4) Profitable businesses undergoing transformation due to rising electricity prices: cryptocurrency mining farms. More specific industry investment logic can be found in the main text.
4 Guojin Research "Global Electricity Shortage 24 Portfolio"
Based on the above analysis and combined with industry investment logic, we ultimately provide Guojin Research's "Global Electricity Shortage 24 Portfolio" for investors' reference, which includes: (1) Energy storage, core targets: Sungrow Power Supply, Canadian Solar, Canadian Solar; beneficiary targets: Trina Solar, East Solar. (2) Power equipment, core targets: Sifang Electric, Jinpan Technology, Igor, Siemens Energy, Eaton, General Electric; Beneficiary targets: Huaming Equipment, Jingquanhua, Shenma Electric Power, Liangxin Co., Ltd., Huadong Cable, Hongfa Co., Ltd. (3) Gas turbines, core target: Yingliu Co., Ltd. (4) SOFC, core targets: Sanhuan Group, Bloom Energy. (5) SMR, beneficiary target: Oklo. (6) Aluminum, core targets: Tianshan Aluminum Industry, Shenhuo Co., Ltd. (7) Pipe materials, core target: Changbao Co., Ltd.
Report Body
As electricity prices in the United States continue to rise, the power shortage problem caused by the significant increase in electricity demand from AI data center construction is gradually becoming prominent. This has shifted the market's focus from the performance and capital expenditure guidance of previous AI tech giants to the "pan-AI" field. The market's main line has also spread from the previous TMT industry to more electricity-related industries, leading to a rebalancing of the market structure. Whether the bottleneck in electricity is hindering the pace of computing power construction, or whether the torrent of computing power demand is elevating the ark of electricity investment, will be an important proposition for the future capital market. However, it is worth emphasizing that the future sources of electricity demand are not limited to AI; in Europe and emerging markets outside the United States, shortages of electricity for various reasons are emerging. The recovery of global manufacturing activity will also bring more electricity demand, so the power shortage is not limited to the United States. We are more inclined to believe that this will be a global electricity shortage cycle, with broader and more lasting impacts. In this process, the advantages of domestic energy and manufacturing industries will become more prominent, thus bringing relevant investment opportunities. In this report, we will analyze the historical review of global electricity shortages, current situation, and the impact on corresponding industries to outline investment opportunities in different sectors for investors' reference.
1 Global "Electricity Shortage History" Since 1980: Electricity Shortages Promote Global Power/Grid Investment, While Manufacturing Power's Export Share Rises
There are two perspectives to judge the stages of global electricity shortages: one is to combine the "quantity and price" changes of electricity. We chose the year-on-year growth rate of electricity consumption in Japan, the United States, and Europe, along with the average industrial electricity price in the corresponding countries/regions as observation indicators. Since domestic electricity prices are controlled, they are not included in the sample. The other perspective is the difference between the year-on-year growth rate of global electricity consumption and the year-on-year growth rate of global actual GDP. If, at a certain stage, there is a simultaneous increase in the year-on-year growth rate of electricity consumption and electricity prices, and the year-on-year growth rate of electricity consumption exceeds the year-on-year growth rate of actual GDP, then it is highly likely that the world is in a relatively electricity-short state during that stage. Therefore, we can conclude that there have been 5 stages of global electricity shortages since 1980: 1986-1989, 1992-1995, 2002-2005, 2009-2011, and 2020-2022. The simultaneous rise in the year-on-year growth rate of electricity consumption and electricity prices is the main consideration, while the condition of electricity consumption growth rate > actual GDP growth rate does not always hold, but it can generally correspond to most stages.
 In the five global electricity shortage phases mentioned above, the investment growth rates related to electricity and the power grid tend to rise significantly. Due to data availability, we can observe that during the electricity shortage phase from 2020 to 2022, the global investment growth rates related to electricity and the power grid saw a substantial increase. For more historical data, we selected the growth rate difference of utility investments in the private sector in the United States compared to overall investments, as well as the credit growth rate related to the utility sector in Japan for representation. It was found that during the electricity shortage phase, the fixed asset investment growth rate of U.S. utilities rebounded from a low point compared to the overall growth rate, while the new credit growth rate for fixed asset investments in Japan's utility sector also tended to rebound from a low point.
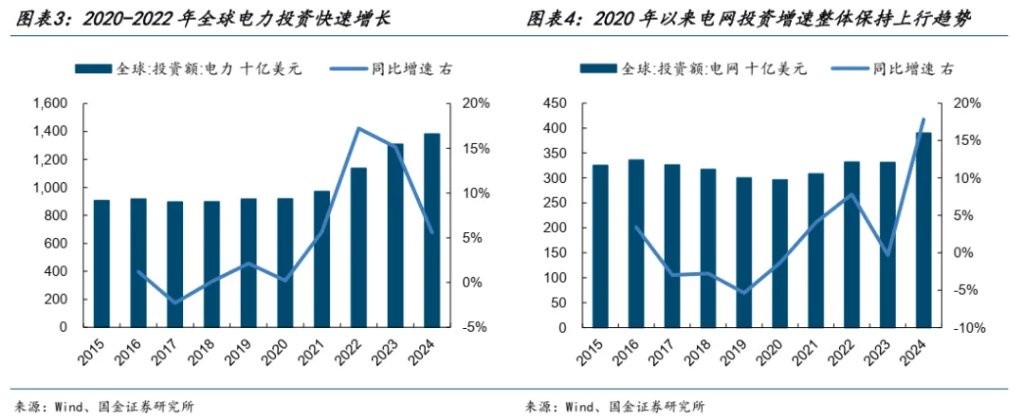
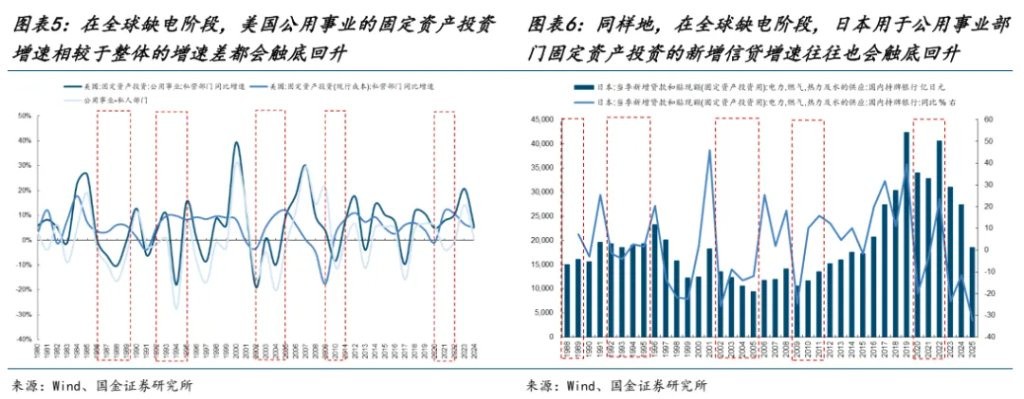
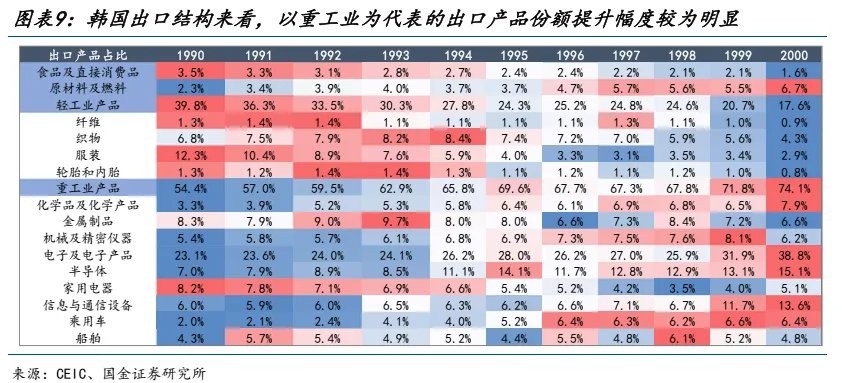
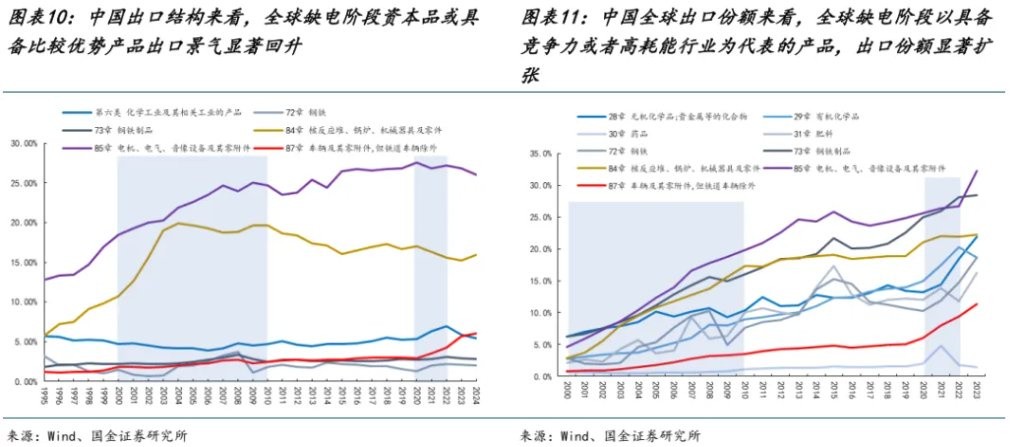
In the context of a global electricity supply shortage, the export share of major manufacturing countries tends to rise. Electricity shortages usually constrain the release of production capacity, especially affecting countries that are heavily reliant on energy. In contrast, manufacturing powerhouses with stable energy guarantees and complete industrial chains are more likely to absorb the transfer of external demand, thereby gaining a larger share of the international market. Reviewing the export performance of major manufacturing countries during global electricity shortage phases since the 1980s: ① Japan: Influenced by the Japan-U.S. trade friction and the Plaza Accord, Japan accelerated the outflow of production capacity, while its domestic export share remained high and volatile during global electricity shortage phases. Notably, Japan's three major industries with comparative export advantages (machinery, electrical equipment, and transportation equipment, which accounted for nearly 70% of Japan's exports by the late 1980s) showed an increasing share in export structure despite no significant expansion in total export volume, reflecting the strong global competitiveness of its core industries. ② South Korea: Benefiting from the global industrial transfer wave (from Japan and Germany to the "Four Asian Tigers"), South Korea accelerated its industrialization process starting in the 1970s. During the later stages of the global electricity shortage that began in the 1980s, due to its enhanced industrial competitiveness, South Korea's export share rose from less than 1% in the early 1980s to 2.4% in 1995, with a particularly noticeable increase in the export share of heavy industrial products. ③ China: In the two rounds of global electricity supply shortages after the 21st century, whether during China's industrialization phase in the early 21st century or the post-pandemic recovery of the global economy from 2020 to 2022, China's export share tended to expand. In terms of structure: first, industries with comparative export advantages continued to expand their export shares; second, high-energy-consuming industries (such as chemicals and steel), which had relatively stable export structure shares in the early stages, experienced both share and structural increases due to limited overseas supply, reflecting the supply advantages of Chinese manufacturing across the entire industrial chain

2 Current Global Electricity Shortage Analysis and Future Outlook
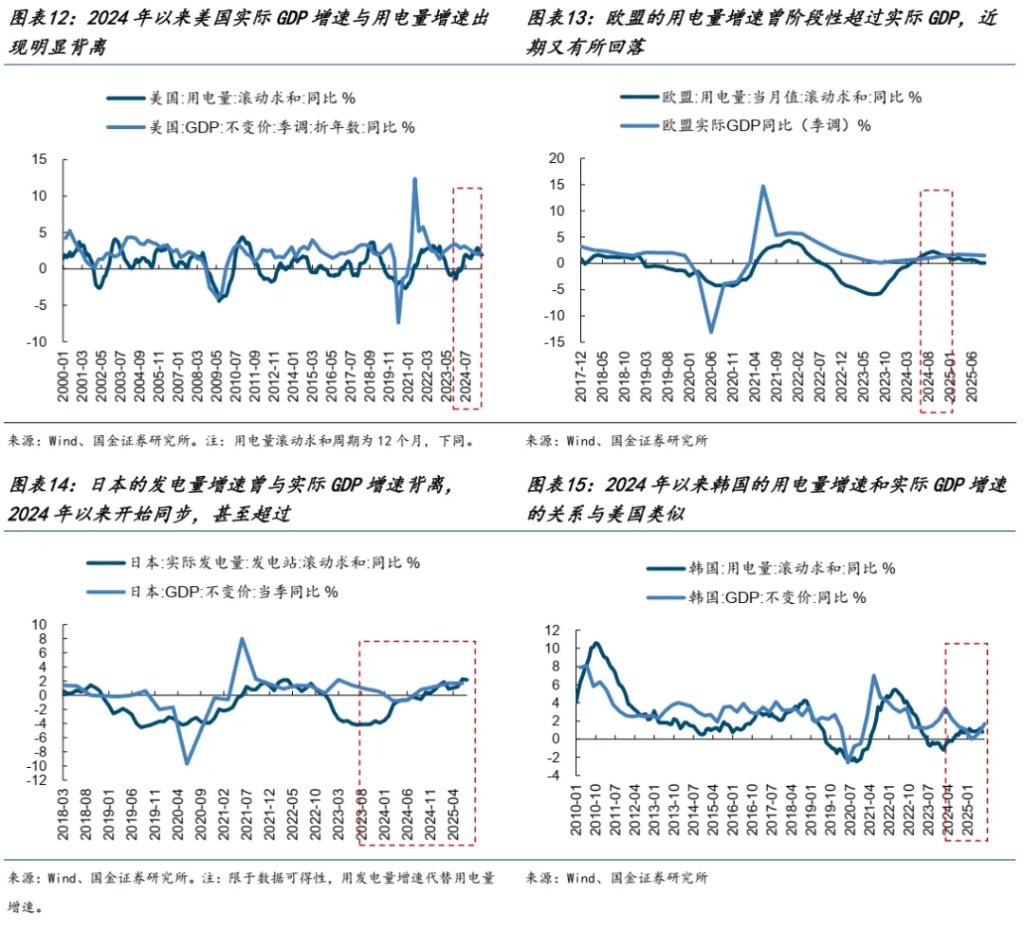
2.1 Currently: The electricity consumption growth rates in the US, Japan, and South Korea are trend-wise outpacing actual GDP growth rates, while Europe has seen a temporary outperformance followed by a decline; China is not facing a power shortage.
Since 2024, the growth rates of electricity consumption in the US and South Korea have shown a significant divergence from actual GDP growth rates, with the gap between the two gradually narrowing, and electricity consumption growth rates even beginning to exceed actual GDP growth rates at times. Japan also experienced a divergence between electricity consumption growth rates and actual GDP growth rates in the second half of 2023, but after 2024, they began to synchronize, with the gap between the two narrowing significantly and electricity consumption growth rates starting to trend higher than actual GDP growth rates. Europe saw a period in the second half of 2024 where electricity consumption growth rates exceeded actual GDP growth rates, but there has been a recent decline. In contrast, China does not face a significant power shortage and even has power redundancy, as analyzed later. Therefore, this round of global electricity shortage currently shows signs, primarily originating from developed manufacturing countries represented by the US, Japan, and South Korea, and may further spread in the future.
2.2 United States: The electricity gap mainly comes from the surge in electricity demand from AI data centers, and the construction and improvement of the power system urgently need to accelerate.
Demand side: Since the second half of 2023, the year-on-year growth rate of electricity prices in the US has continued to rise. However, as capital expenditures for AI continue to expand, the demand for electricity from data centers has also increased significantly, making the issue of electricity shortages more pronounced. According to the estimates from the electronic industry group of Guojin Securities Research Institute regarding the energy demand brought by data centers in the future [1], the US will account for more than half of the global demand until 2028.
[1] Note: This does not consider the existing supply-demand gap in the US power system but only the additional energy demand brought about by the construction of AI data centers.
 Power Side: The main contribution to installed capacity growth comes from photovoltaics and gas power, but the fastest-growing installation is SOFC. Specifically:
(1) Gas/Coal/Nuclear Power: Focus on gas power and SMR
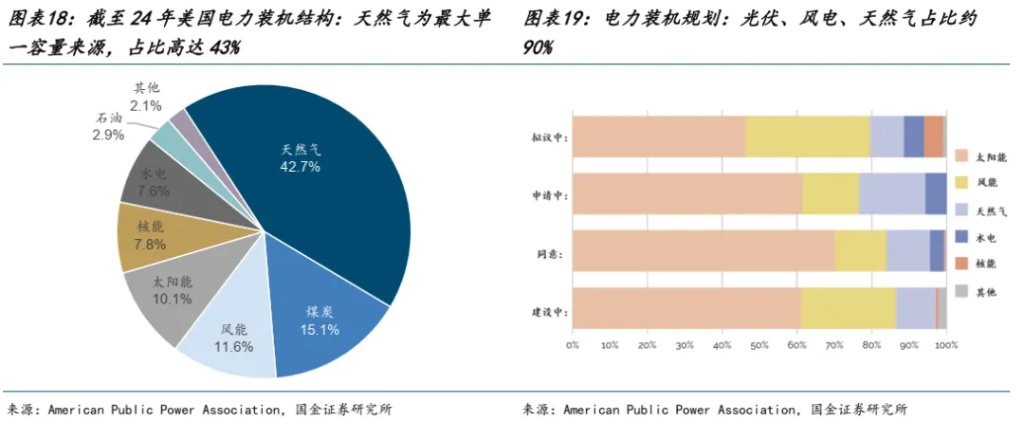
By the end of 2024, the total installed capacity of electricity in the United States is approximately 1.3TW, with natural gas being the largest single source of capacity, accounting for as much as 43%, followed by coal (15%), and wind, solar, nuclear, and hydropower together accounting for over 1/3. In terms of new installations, over 98% of the new capacity from 2017 to 2024 comes from solar, natural gas, and wind energy, with natural gas being the main source of new installations from 2017 to 2018, and solar installations significantly increasing since 2021. Based on current electricity installation plans, photovoltaics, wind power, and natural gas account for about 90%, with solar and wind being the core of growth, while natural gas continues to maintain certain growth as a transitional energy source.
(1) Gas Power: The largest source of domestic energy production in the U.S., with dual advantages of cost and resources
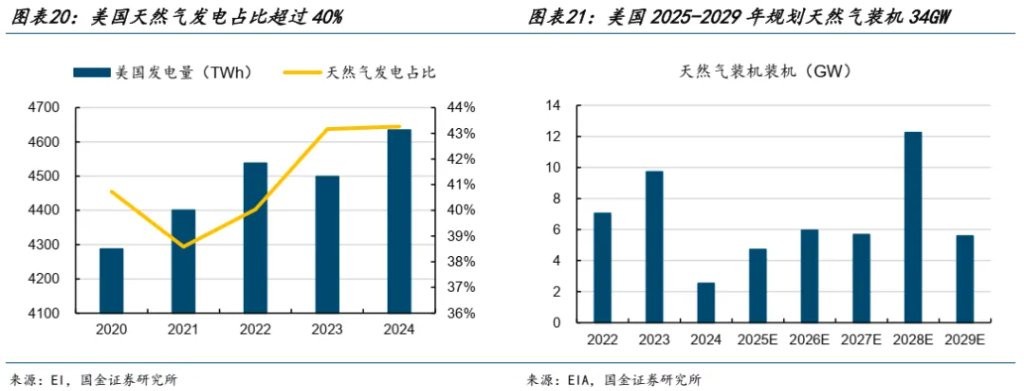
The United States has grown to become the world's largest natural gas producer due to the shale gas revolution, while gas power plants have achieved a comprehensive generation cost advantage over coal power due to lower fixed investment and operation and maintenance costs. Currently, gas power is the largest power source in the U.S., with a total generation of 2005TWh in 2024, accounting for as much as 43%. According to EIA disclosures, by the end of 2024, the total installed capacity of natural gas power generation in the U.S. is 571GW, with plans for an additional 34GW of gas installations from 2025 to 2029.
(2) Coal Power: Existing units have long operational lifespans and face ongoing retirement pressure
In terms of the operational years of installed capacity in the U.S., traditional coal power is mainly concentrated in units that began operation between 1960 and 1990. By the end of 2024, the total installed capacity of coal power is 189GW, with a high proportion of installed capacity over 30 years old, indicating a serious aging issue. According to EIA disclosures, the U.S. no longer plans for new coal power installations, with plans to retire 31GW of coal power from 2025 to 2029. Even if retirement plans are slowed, there is still ongoing pressure from the supply side.

(3) Nuclear Power: Government policies support, and SMR attention continues to rise
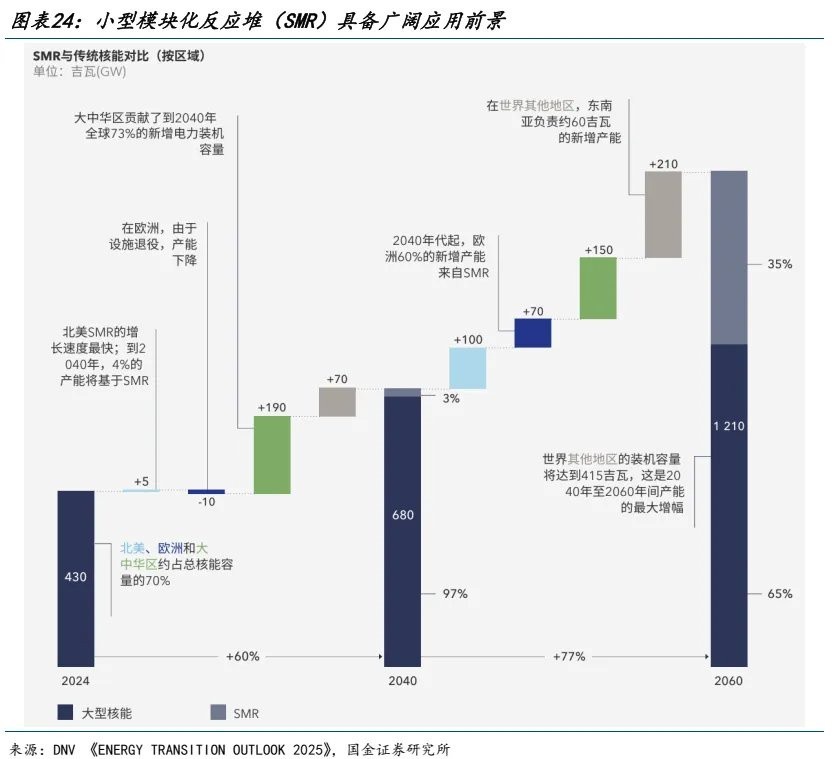
According to EIA, the U.S. currently operates 103GW/96 nuclear power plants, most of which were built in the 1970s and 1980s. On May 5, 2025, U.S. President Trump signed a series of executive orders, including "Revitalizing the Nuclear Industry Foundation" and "Reforming the Department of Energy's Nuclear Reactor Testing," announcing the goal of "rebuilding America's nuclear energy leadership," with plans to increase the U.S. nuclear power installed capacity from 100GW to 400GW by 2050 The need for round-the-clock, high-density, low-emission power supply in ultra-large-scale data centers has increased the importance of nuclear energy. Small Modular Reactors (SMRs) have broad application prospects due to their flexible deployment and lower long-term costs.
(2) Wind and Solar Hydrogen Storage: Main Source of Installed Capacity Increase
(1) Photovoltaics: Policy Impacts Short-Term Installations, AI Expected to Drive Subsequent Demand
In the new photovoltaic installations in the United States, centralized systems account for a high proportion (according to SEIA, centralized systems accounted for 80% of new installations in the first half of 2025). The demand for photovoltaic installations is mainly driven by centralized systems. According to EIA, from January to September 2025, the new utility-scale photovoltaic installations in the U.S. reached 17.36 GW, basically flat year-on-year, with Q3 new installations at 5.25 GW, a year-on-year increase of 11%, mainly due to the gradual release of some demand that was on hold prior to the implementation of the "Inflation Reduction Act" (OBBBA).
The "Inflation Reduction Act" (OBBBA) was officially signed into law on July 4, which significantly impacts the demand for photovoltaic installations in the U.S. regarding tax credits and the concept of Foreign Entities of Concern (FEOC):
① OBBBA reduced the subsidy intensity for U.S. photovoltaic projects, with residential photovoltaic subsidies terminating at the end of 2025 (originally scheduled to phase out starting in 2033 and terminate in 2035), and ITC and PTC subsidies for centralized photovoltaic projects terminating at the end of 2027 (originally scheduled to phase out before 2034 and terminate in 2036).
② Products from companies classified as FEOC (headquartered in China or having equity ties with China) will not be eligible for tax credits.
Additionally, projects that commence construction before July 4, 2026, and are completed within four years can retain ITC and PTC tax credit eligibility by completing the "Safe Harbor" filing. Due to this provision, it is expected that there will be a rush of installations in the U.S. photovoltaic market in 2025-2026, which will somewhat boost the demand for new photovoltaic installations. We anticipate that the new photovoltaic demand in the U.S. will remain basically flat in 2025-2026, with subsequent demand gradually recovering driven by AI and electricity consumption from data centers.

(2) Wind Power: Policy-Driven Demand Cycle, "Inflation Reduction" Act to Drive Demand Growth from 2025 to 2028
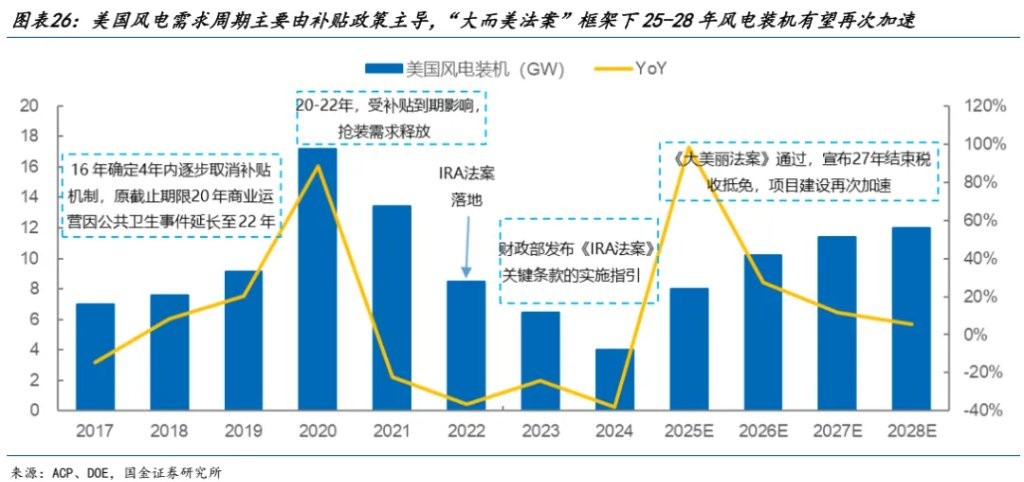
Reviewing the history of wind power installations in the U.S., changes in subsidy policies are the main factors affecting wind power demand. In 2016, the U.S. government announced a gradual phase-out of the subsidy mechanism over four years (later extended to 2022), which led to a concentrated release of wind power demand from 2020 to 2022; in 2022, the Biden administration introduced the IRA Act, which implemented tax credits for wind and solar new energy projects to stimulate increased investment in the industry. However, the industry is expected to decline in 2023-2024 due to factors such as high interest rates In 2025, after Trump takes office, the "Big and Beautiful" Act will be announced, canceling tax credit incentives for new wind and solar projects that have not started construction before July 4, 2026, and have not achieved production by the end of 2027. The construction of wind power projects in the United States will accelerate again, with installed wind power capacity expected to gradually increase from 8GW to 12GW from 2025 to 2028.
(3) Energy Storage: AIDC exacerbates grid load fluctuations, and the demand for energy storage regulation continues to grow
As a completely clean energy source, energy storage has extremely fast deployment speed and cost advantages, and can participate in peak shaving and frequency regulation services for the grid. With the growth of AIDC demand in the United States, grid volatility is further exacerbated. At the same time, due to limited grid capacity, the application scenarios for energy storage are gradually extending from behind the meter to front of the meter, which can generally be divided into the following three categories:
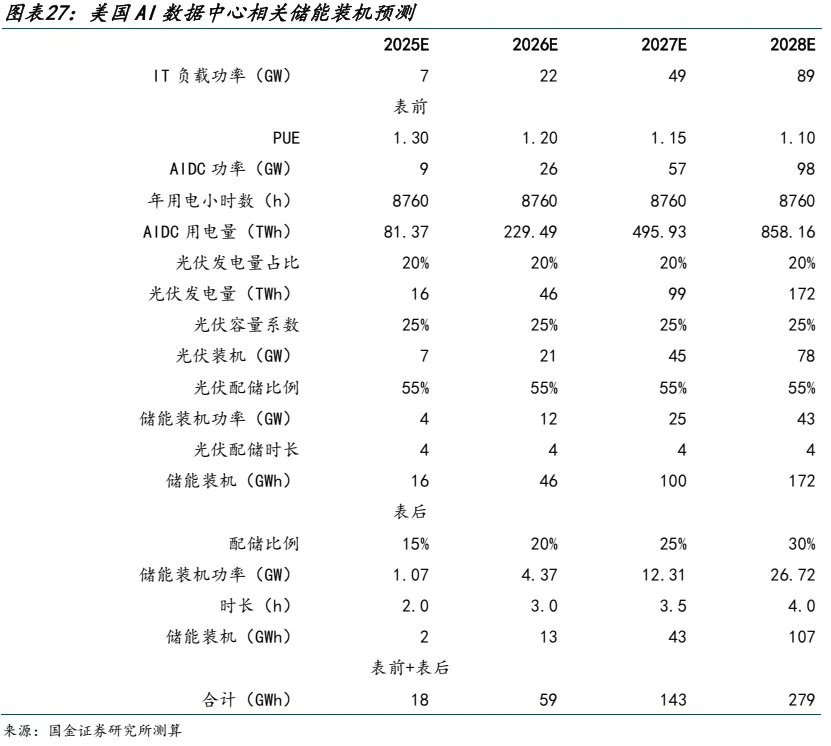
① PPA agreements or main power source supplementation (front of the meter): To address insufficient grid capacity and meet increasingly stringent ESG requirements, "solar + energy storage" systems are becoming an important supplementary power source for AIDC in the United States or a key choice for power supply through the PPA model. Although the large-scale deployment of solar power is constrained by land, initial investment, and regional sunlight resources, we predict that about 20% of the new electricity demand from AIDC in the United States from 2025 to 2028 will still be met by solar power generation. Based on this solar penetration rate and referring to the commonly used storage duration in the industry, we estimate that the corresponding energy storage installation demand will be 16/46/100/172GWh.
② Smoothing load fluctuations (behind the meter): The computational load fluctuations of AI data centers are significant, generating instantaneous peak power during concentrated training or inference, which impacts the grid. Energy storage systems can respond instantly to smooth these drastic load fluctuations and can also participate in peak shaving and frequency regulation services in the electricity market to generate revenue. In addition, according to a letter from the U.S. Department of Energy (DoE) to the Federal Energy Regulatory Commission (FERC) on October 23, there may be an acceleration of the grid connection process for data centers that agree to accept load response, further promoting the deployment of energy storage in data centers.
③ Backup power source (behind the meter): To ensure business continuity during grid failures, data centers need reliable backup power sources. Energy storage is gradually replacing traditional lead-acid batteries, becoming a cleaner backup power solution. For example, Google has configured a 2-hour duration energy storage system at its data center in Belgium. As the reliability challenges of the grid increase, the backup power duration for data centers may evolve from the current 2 hours to 4 hours in the future.
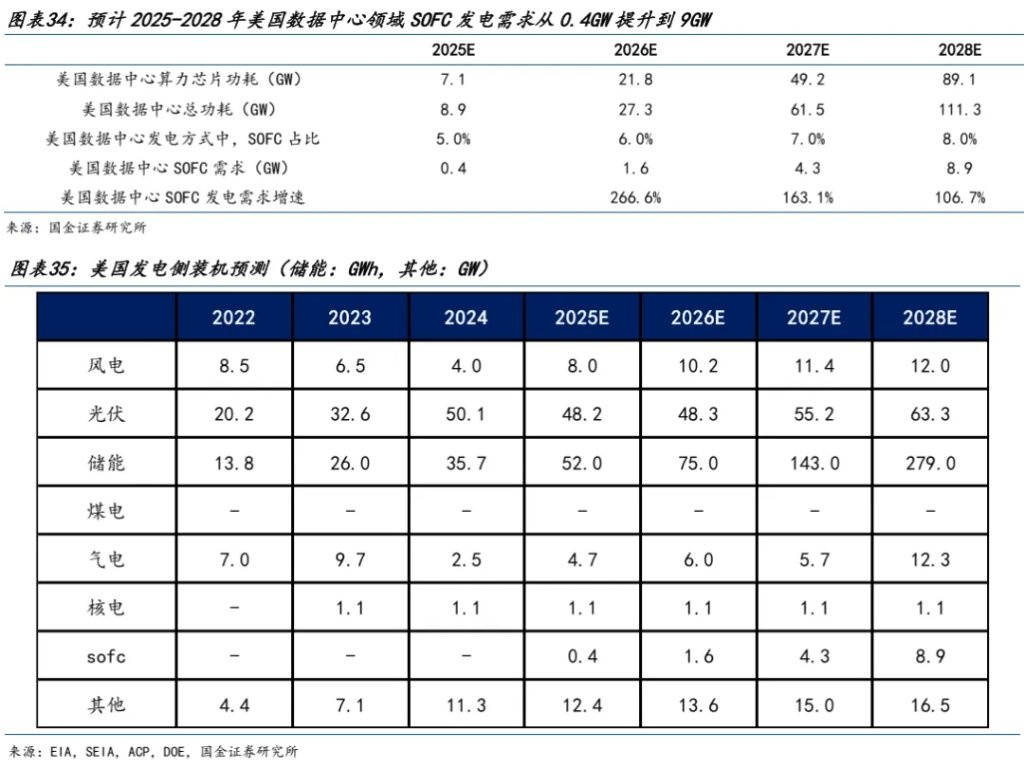
Considering the future increase in power density and volatility of AI data center clusters, it is expected that the energy storage ratio for AI data centers ②+③ will gradually increase from 15% to 30%, and the duration will increase from 2 hours to 4 hours, corresponding to energy storage installations of 2/13/43/107GWh In summary, we expect the energy storage demand brought by AI data centers in the United States from 2025 to 2028 to be approximately 18/59/143/279 GWh.
(4) SOFC: The U.S. power gap combined with short-term demand overflow presents a significant development opportunity for SOFC as a primary power source
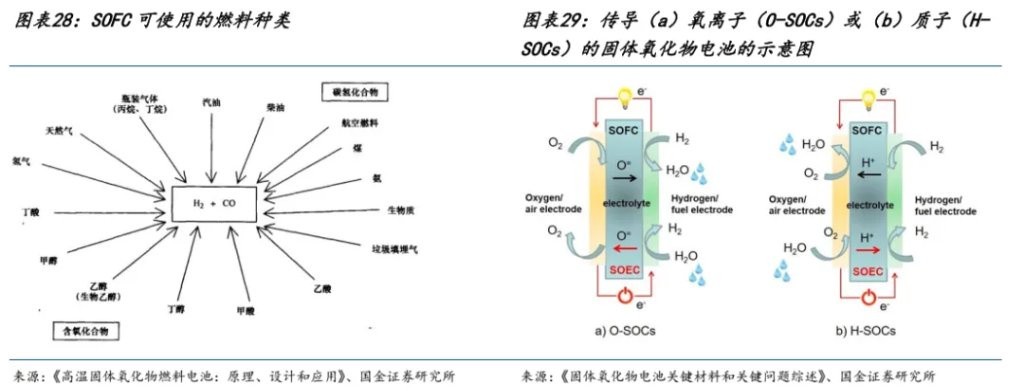
SOFC has a wide range of fuel options and high power generation efficiency, suitable for combined heat and power (CHP) and stationary power generation. Solid Oxide Fuel Cells (SOFC) are high-temperature all-solid-state devices that convert the chemical energy of fuels such as hydrogen, natural gas, and other hydrocarbons into electrical energy. A single cell consists of an anode, a cathode, and a solid oxide electrolyte, all made from ceramic materials, where the anode and cathode serve as the sites for fuel oxidation and oxidant reduction, respectively. The catalysts for both electrodes use ceramic membranes, and the SOFC system consists of one or more modules along with heat exchangers, gas reformers, turbines, etc. Due to the high operating temperature (typically 600-800℃), SOFC has many advantages compared to other energy conversion technologies, such as low material costs (no precious metals required), high efficiency (self-generation efficiency close to 60%, with recovered heat utilization efficiency reaching up to 85%), and fuel flexibility (broad sources).
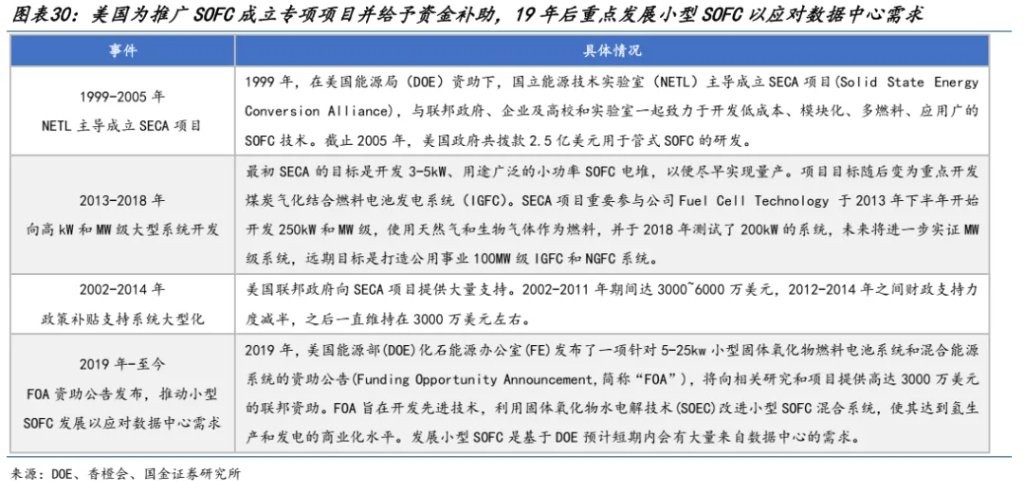
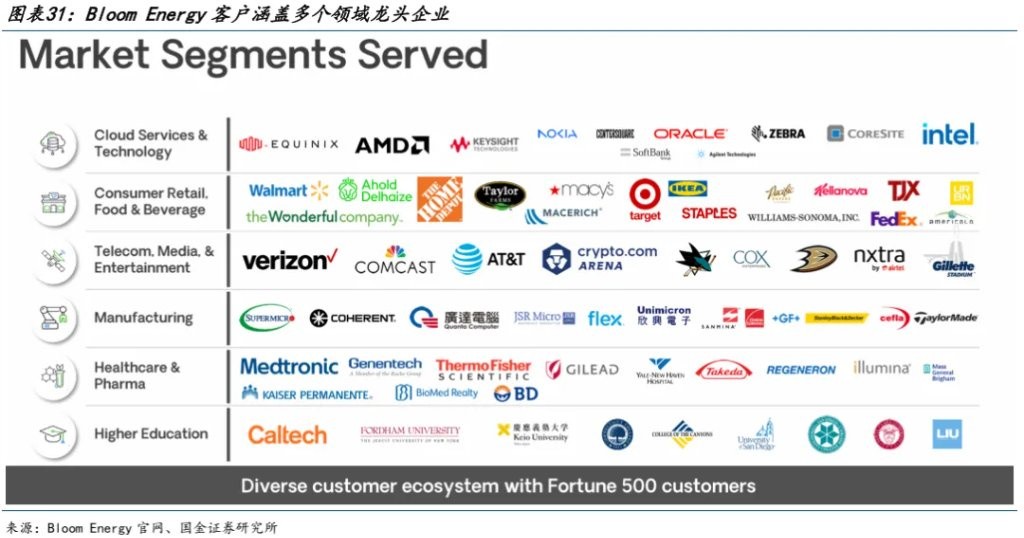
The cumulative installed capacity of SOFC in the United States is the highest in the world, with major application scenarios including power supply for medium and large commercial and industrial uses, as well as data centers. Bloom Energy, as the main SOFC supplier, has invested over 1 GW in products, with applications in data centers, banks, hospitals, and other related institutions. The advancement of SOFC technology in the U.S. benefits from active guidance and financial support from the federal government, while some local state governments also promote SOFC deployment through subsidies or tax reductions.
AI data centers are one of the scenarios with the greatest potential for SOFC applications. SOFC can be used as a distributed power generation device, with (cooling) combined heat and power being its optimal solution. Major companies such as APPLE, GOOGLE, AT&T, EBAY, as well as hospitals, commercial districts, and industrial parks in the U.S. have mature applications. Especially as the electricity consumption in the U.S. surges due to the impact of data centers, the connection of high-power data centers to the grid will create a significant burden, making self-sufficient power supply for large data centers an inevitable trend. With a conversion efficiency of up to 60% and the characteristics of combined heat and power, SOFC technology can not only provide stable electricity for data centers but also enhance the efficiency of cooling systems by recovering waste heat, achieving efficient energy utilization, making it an important technological development trend for AI data center power supply The products developed by Bloom Energy have been applied in many companies such as Oracle, Intel, and eBay.
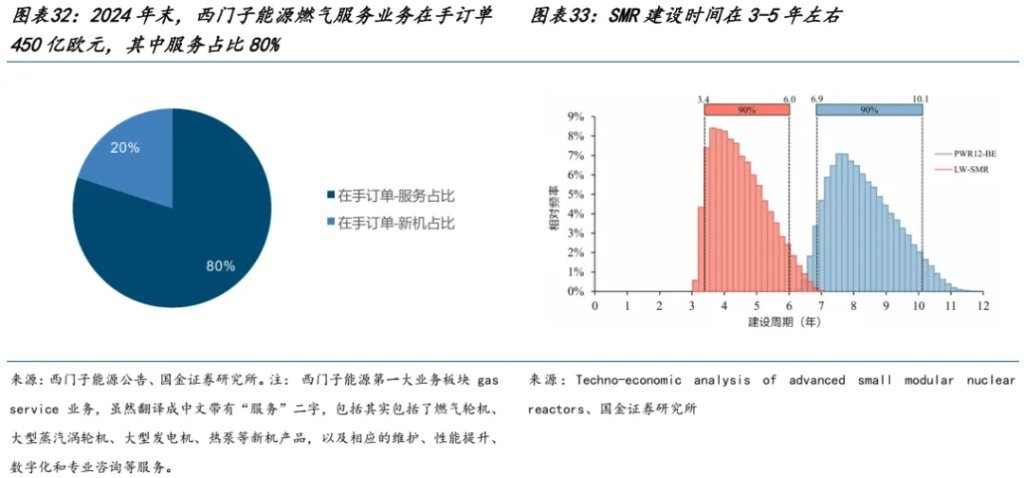
With tight gas turbine supply and long construction cycles for Small Modular Reactors (SMR), the demand for data center power is overflowing, presenting a significant opportunity for Solid Oxide Fuel Cells (SOFC). Gas turbines and small nuclear power plants (SMR) were previously the mainstream choices for data center power. According to orders from GE, Siemens, and Mitsubishi, the production of large gas turbines has been scheduled until 2028, leading to tight supply and demand; the construction cycle for SMR takes 3-5 years, which is relatively long. SOFC has advantages such as quick deployment (3 months), ample spot supply, high power generation efficiency, and rapid expansion, making it capable of meeting the current shortage of data center power. Additionally, based on the IRA provisions, downstream manufacturers purchasing SOFC systems from 2026 to 2033 can receive a 30% Investment Tax Credit (ITC), reducing acquisition costs.
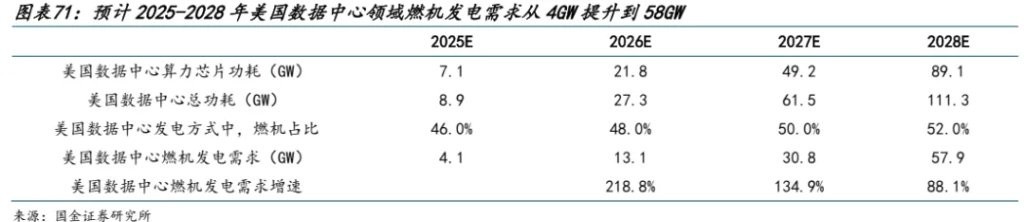
According to estimates by the Guojin Electronics team, it is expected that from 2025 to 2028, the power consumption of computing chips in U.S. data centers will increase from 7.1GW to 8.9GW. Considering the power consumption of cooling systems, computing chips account for about 80% of the total power consumption of data centers, leading to an overall increase in total power consumption from 8.9GW to 111.3GW. Assuming SOFC accounts for 5%-8%, the corresponding demand for gas turbines would be 0.4-0.9GW, with growth rates of 266.6%/163.1%/106.7% for 2026-2028.
In addition to the installation forecasts for the aforementioned power sources, there is a new perspective: cryptocurrency mining farms are fully transitioning to AI data centers. It is noteworthy that if the price of Bitcoin falls below $56,645, cryptocurrency mining farms may consider a full transition, which would bring about 18GW of new power supply, alleviating the power shortage situation.
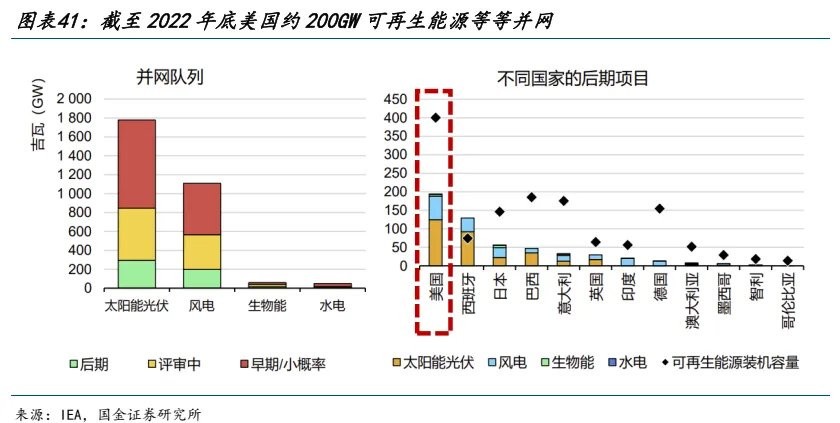
Since 2024, many cryptocurrency mining farms engaged in Bitcoin mining have begun to transition to AI cloud services and data center businesses. On one hand, the overall computing power of the Bitcoin network is growing, and the mining difficulty is increasing. The four-year Bitcoin halving event also forces mining farms to add or update mining machines to maintain output, leading to continued high capital expenditures for cryptocurrency mining companies. Moreover, the cryptocurrency industry experiences significant cyclical fluctuations and relatively unstable revenue, but equipment depreciation is a fixed cost, making it difficult for capital markets to provide stable cash flow expectations for cryptocurrency mining companies. On the other hand, due to the retirement of power plants and the increase in power load brought by AI, the U.S. Department of Energy estimates that by 2030, the U.S. will need to add 100GW of peak power supply, of which 50GW will be directly used for data centers Companies engaged in cryptocurrency mining have power infrastructure that is already electrified and has high communication bandwidth near major metropolitan areas, with electricity costs generally between 3 to 5 cents, making them naturally suitable for AI cloud service businesses. With the growing demand for AI computing power, most cryptocurrency mining farms have announced their transition to AI data centers. We have summarized the transformation status and plans of key companies:
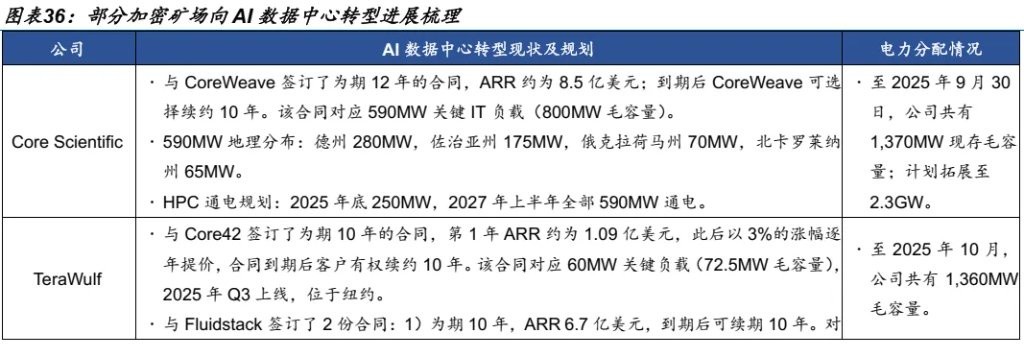
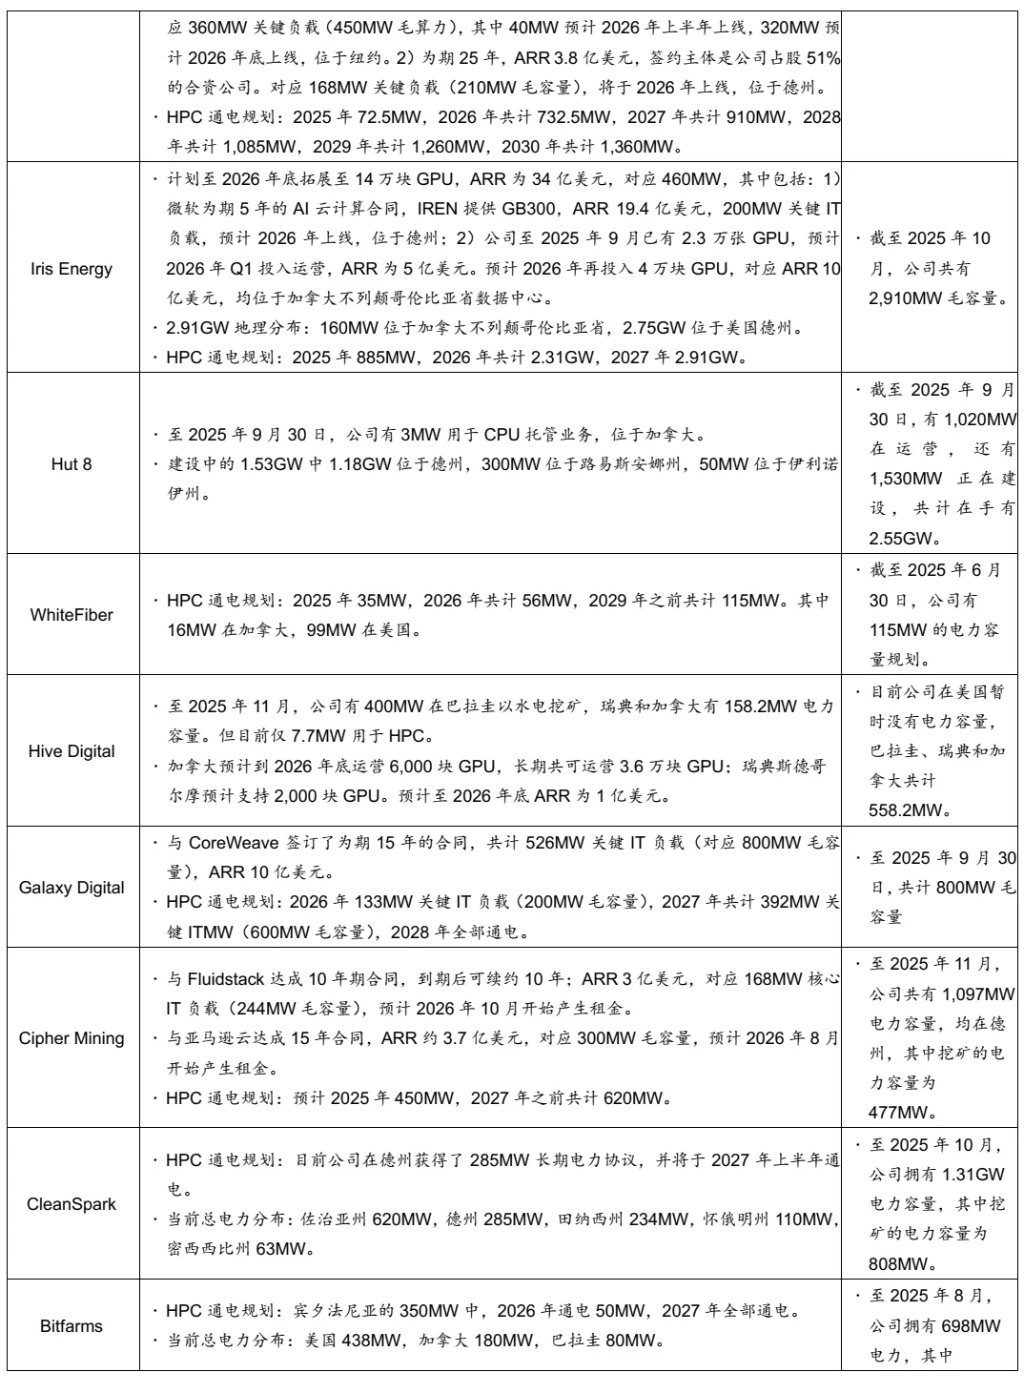

It is expected that the transformation of cryptocurrency mining farms can partially alleviate the current power shortage of AI data centers in the United States. Our statistics show that 15 publicly listed cryptocurrency mining companies in the U.S. currently hold a total power capacity of 19,895 MW, of which 17,758 MW is in the United States. Currently, 9.15 GW of power is clearly transitioning to AI data centers, with an expected 4,437 MW and 7,871 MW to be electrified in 2026 and 2027, respectively; there are still 6,866 MW of U.S. power being used for mining.
In a previously published report titled "Overseas Cryptocurrency Mining Farms are Transitioning to AI Computing Power," we calculated the electricity costs of various companies for mining and the IRR for transitioning to AI computing centers. Assuming the mining electricity and maintenance costs (excluding depreciation) are $47,015, the IRR for the Tera Wulf AI data center contract is 17% (assuming full-term renewals). Since the procurement cost of mining machines is a sunk cost when making decisions, cryptocurrency mining farms may consider a full transition when the price of Bitcoin falls below $56,645. After the mining machines are fully depreciated, when considering new purchases, cryptocurrency mining farms need to compare the mining revenue including depreciation with the revenue from transitioning to AI data centers. Assuming the mining cost (including depreciation) is $88,493, the company would prioritize transitioning to AI data centers when the price of Bitcoin falls below $106,618, rather than repurchasing new mining machines to engage in cryptocurrency mining.
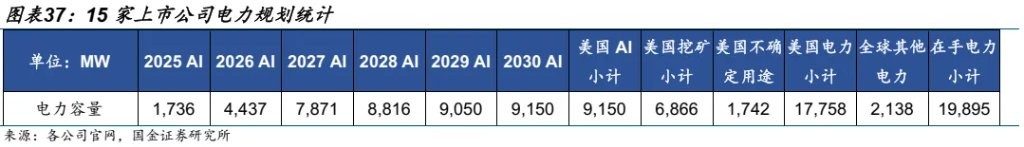
 On the U.S. power grid side: Over the past 20 years, the addition of new transmission lines in the U.S. has been minimal, the aging of grid equipment is severe, power outages due to transmission issues are frequent, and existing infrastructure urgently needs upgrading. Most of the U.S. grid systems were built in the mid-20th century, and many devices and materials are nearing or exceeding their expected lifespan, with about 50% of transmission lines being over 20 years old, leading to a diminishing ability to withstand disturbances. Since 2015, the frequency of transmission outages has significantly increased. To meet the electrification demands driven by electric vehicles, heat pumps, and data centers, as well as to integrate decentralized renewable energy, the grid urgently needs enhancement.
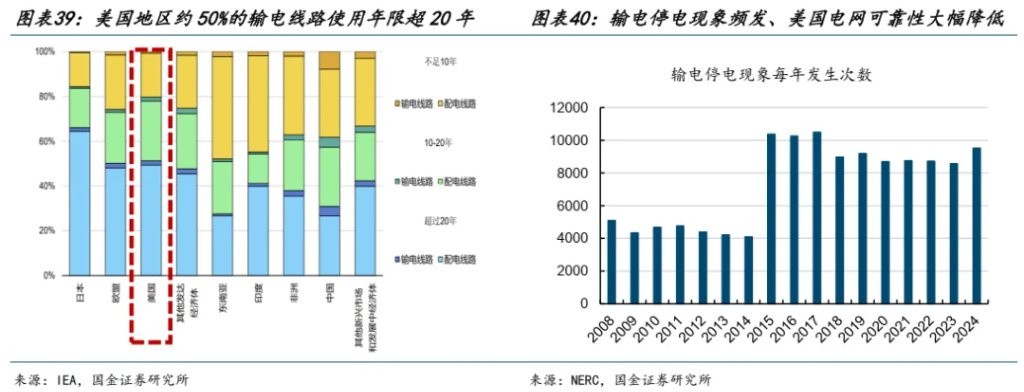
Hundreds of GW of new energy projects in the U.S. are stuck in the grid interconnection queue. According to the IEA, the growth of renewable energy in the U.S. is hindered by a backlog of large-scale grid connections, with approximately 200 GW of renewable energy projects trapped in the grid queue by the end of 2022. These delays are caused by outdated infrastructure, slow permitting processes, and fragmented regulations. The average time for a project in the U.S. from the initial grid request to operation has increased, with most requests ultimately withdrawn due to uncertainty and costs. Due to a lack of transmission infrastructure and interconnections, renewable energy also has to be curtailed.
The biggest constraint affecting the construction of the U.S. power grid and the expansion of power infrastructure capacity is the "lack of personnel." The market is facing severe challenges from an aging workforce and a shortage of skilled labor. According to Goldman Sachs, it is expected that from 2023 to 2030, about 510,000 new jobs related to power and grid will be needed in the U.S. Against the backdrop of an aging workforce, these positions require extensive skills training (3-4 years). The U.S. energy sector (such as electricians, line workers, and grid technicians) currently has about 45,000 active apprentices, and by 2030, there will still be a labor gap of 78,000 in the transmission and distribution field, unable to meet the anticipated demand.

Grid modernization remains a core priority for utilities, and the industry is entering the early stages of a decades-long investment cycle driven by load growth, aging infrastructure replacement, and increasing complexity at the distribution level. As electricity demand grows, network operators are seeking to upgrade and expand grid infrastructure to accommodate clean energy and enhance grid reliability. According to Wood Mackenzie (25.10), investments in the U.S. transmission and distribution grid are expected to exceed $140 billion by 2030.

2.3 Europe: The development of emerging industries and the trend of electrification together increase electricity demand, but the power system's excessive reliance on new energy remains an unstable factor.
On the demand side, from 2008 to 2024, affected by factors such as the global financial crisis and public health events, Europe's electricity demand has decreased by about 7%, with an accumulated decline of nearly 8% in industrial electricity consumption; according to forecasts by Goldman Sachs Research, as electrification in Europe progresses and emerging industries such as electric vehicles and data centers drive demand, Europe's electricity demand is expected to gradually achieve moderate recovery starting in 2025, with a projected CAGR of 1.3% for electricity demand from 2024 to 2027, accelerating to a CAGR of 2.0% from 2027 to 2030.
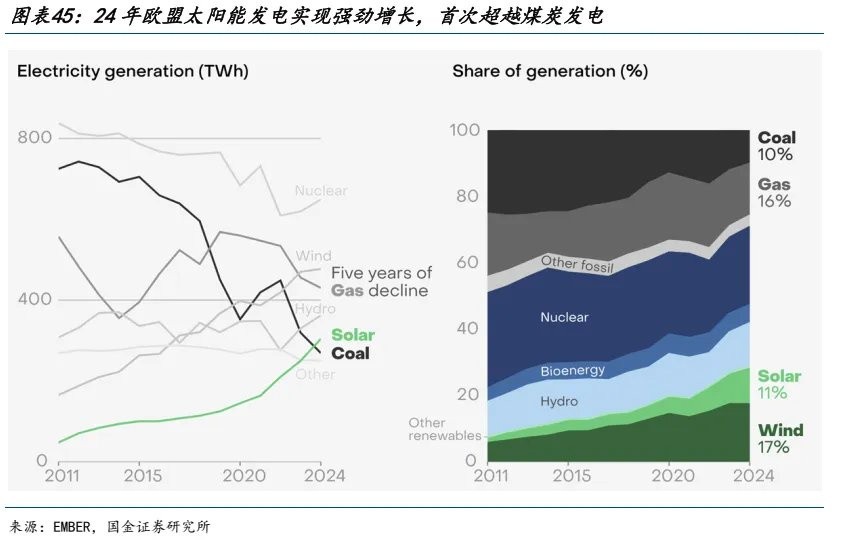
On the supply side, in 2024, 24%/13% of the EU's electricity will come from nuclear power generation/hydropower generation, while the European Green Deal drives profound transformation and rapid development of the EU electricity industry. In 2024, solar power generation in Europe will achieve strong growth, surpassing coal power generation for the first time, with the share of renewable energy rising from 34% in 2019 to 47% in 2024, and the share of fossil energy decreasing to 29%, far below the global average level of 59%.
(1) Photovoltaics: Steady growth in new installations
By June 2025, photovoltaics will become the largest source of electricity in the EU for the first time, accounting for 22.1% of the total electricity structure. However, the European Photovoltaic Industry Association (SEP) has lowered its expectations for new photovoltaic installations in the EU for 2025 (from 65.5GWdc at the end of 2024 to 64.2GWdc by July 2025), mainly due to downward pressure on electricity prices and weakened subsidies in some regions leading to a slowdown in distributed demand. From 2020 to 2023, distributed demand accounted for about 30% of the EU's photovoltaic installation capacity, and it is expected to decrease to 15% by 2025; meanwhile, centralized demand continues to grow, supporting sustained growth in photovoltaic installation demand in Europe. We expect steady growth in new photovoltaic installation demand in Europe from 2025 to 2028.
 (2) Wind Power: Demand Expected to Return to Growth
From the perspective of energy structure, Europe heavily relies on imported fossil fuels. According to EMBER statistics, 58% of primary energy consumption in EU countries comes from imported fossil fuels, which is relatively high among major economies in the world. After the Russia-Ukraine conflict, EU countries' demand for energy independence has increased, with clean energy led by wind and solar becoming the main alternative to fossil fuels. The scale of wind power project bidding in various countries continues to increase, gradually releasing wind power demand in Europe. According to Wind Europe statistics, it is predicted that wind power installed capacity in Europe will be at the level of 15-20GW from 2021 to 2024, and is expected to gradually increase to around 30GW from 2026 to 2028.

(3) Energy Storage: Energy Crisis Accelerates Large-Scale Storage Development, AIDC Brings Growth in Electricity Consumption
The energy crisis triggered by the Russia-Ukraine conflict in 2022 has elevated energy security to a strategic height for European countries. By 2024, the proportion of renewable energy generation in the EU is expected to reach 47.3%, with wind power and photovoltaics accounting for 17.4% and 11.1%, respectively, laying a policy foundation for the development of energy storage. The major blackout event in Spain in 2025 further accelerated policy support. The Spanish government subsequently approved Royal Decree 7/2025, which explicitly listed energy storage facilities as "public utilities" for the first time, granting them the same legal support as generation facilities in terms of land acquisition and approval permits. This event prompted European governments to resolve issues of grid instability, introducing proactive policies regarding energy storage grid connection approvals, transmission and distribution fees, and capacity bidding.
AIDC drives electricity demand in Europe, and flexible resources such as energy storage are highly favored. In 2024, electricity consumption by data centers in Europe is expected to be about 96TWh, equivalent to 3% of the region's total electricity demand. In core markets where data centers are highly concentrated, this proportion has a more significant impact on local power systems. In 2023, electricity consumption by data centers accounted for 33% to 42% of total electricity consumption in Amsterdam, London, and Frankfurt, while in Dublin, this proportion was as high as 80%. According to estimates by the International Energy Agency, if European data centers provide only 30 hours of flexible response per year, the available grid capacity could potentially double. To ensure uninterrupted operation of data centers, flexible solutions largely rely on support from on-site generation equipment and battery storage systems. It is expected that in the future, the prosperity of the European energy storage market will further rise. We estimate that the energy storage demand brought by AI data centers in Europe from 2025 to 2028 will be approximately 9/28/58/107GWh.
 2.4 Emerging Markets: The Electricity Gap Mainly Comes from the Surge in Electricity Demand Driven by Infrastructure and Industrialization Acceleration
From the perspective of emerging markets, there is an increasing urgency among major economies to promote infrastructure construction. In recent years, the resurgence of "resource nationalism" has led some resource-rich countries, represented by Indonesia, to strengthen export controls on their mineral resources. On one hand, this aims to readjust the distribution of resource revenues and protect national economic interests; on the other hand, it reflects these countries' commitment to breaking away from a single-resource export model, hoping to enhance the export added value of products by extending the industrial chain and developing downstream processing industries. However, the primary constraint faced by emerging economies in their industrialization process is the issue of insufficient infrastructure, which in turn will limit the industrialization process of these economies. Therefore, infrastructure construction and improvement are also essential key supports in the current industrialization process of emerging economies. We use the "Belt and Road" infrastructure development demand index to measure the demand for infrastructure development in emerging economies, with higher values indicating stronger infrastructure development demand and greater development potential. The results show that regions such as Central Asia, the Commonwealth of Independent States (CIS), Mongolia, and Southeast Asia have a stronger demand for infrastructure development; from a marginal trend perspective, the demand for infrastructure development in emerging economies in Latin America and Africa has significantly increased in recent years, indicating greater development potential in the future.
The industrialization process of emerging economies may lead to rapid growth in electricity demand. Looking back at the industrialization processes of major countries since the 1960s, whether it is Japan's post-war economic reconstruction or the industrialization of economies such as Singapore, South Korea, and China, during the stage when the value added of their manufacturing industries significantly increased as a proportion of GDP, the growth rate of electricity consumption in these countries has consistently outpaced that of the rest of the world, creating a noticeable "electricity growth gap." This means that, on one hand, as the industrial system improves and infrastructure expands, the demand for electricity in various countries significantly increases, especially when they develop into major manufacturing countries, as the continuous export of products will keep the growth rate of electricity consumption at a high level; on the other hand, infrastructure construction itself also requires the construction and improvement of supporting electricity systems, which will generate demand for relative electrical equipment. In fact, from the development demand index of various fields in "Belt and Road" countries, the demand for electricity engineering development continues to rank among the top, and regions represented by Latin America and Africa have relatively low per capita electricity consumption, indicating that there is still significant potential for electricity demand in the infrastructure construction process of current emerging economies.

 2.5 China: The Power System Has Certain Redundancies, and the Advantages of Energy Prices and Manufacturing Capacity Are More Prominent Against the Global Background of Power Shortages
The supply capacity of China's power system is calculated based on two core variables:
(1) Core Variable One: The proportion of non-fossil energy generation. In China's electricity statistics, fossil energy generation is equivalent to thermal power generation (broadly defined as thermal power generation includes oil, coal, gas, etc.), while non-fossil energy generation includes hydropower, nuclear power, wind power, and solar power. The total generation can be inferred from the proportion of non-fossil energy generation.
(2) Core Variable Two: Renewable energy generation. Renewable energy generation is the amount of non-fossil energy generation excluding nuclear power, which includes hydropower, wind power, and solar power. Renewable energy generation can be calculated as a whole, i.e., non-fossil energy generation = renewable energy generation + nuclear power generation.
Thus, the total generation of the power system = (nuclear power generation + renewable energy generation) / proportion of non-fossil energy generation.
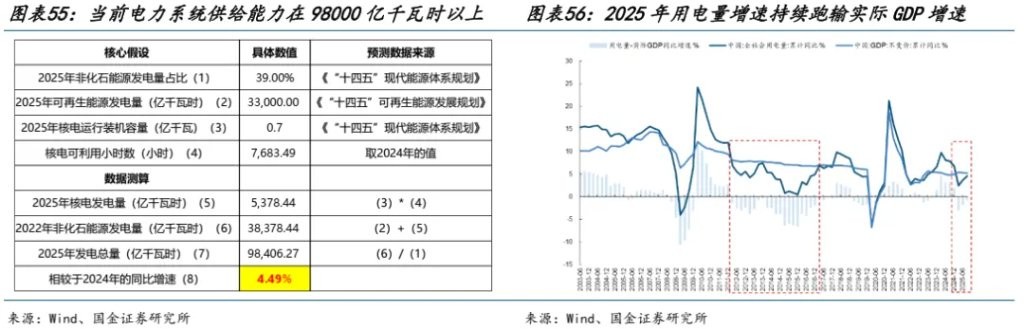
First, regarding the proportion of non-fossil energy generation, according to the "14th Five-Year Plan" for Modern Energy System Planning, by 2025, the proportion of non-fossil energy generation (hydropower + nuclear power + wind power + solar power) is expected to reach around 39%. In 2024, this ratio is only 34%. Although in the first three quarters of 2025, this ratio has increased to 35%, there is still a significant gap to reach 39%. Therefore, there is still considerable room for growth in non-fossil energy generation in the future.
Second, regarding renewable energy generation, according to the "14th Five-Year Plan" for Renewable Energy Development, by 2025, renewable energy generation (hydropower + wind power + solar power) is expected to reach about 3.3 trillion kilowatt-hours. In 2024, renewable energy generation is 2.78 trillion kilowatt-hours, which means that the year-on-year growth rate of renewable energy generation in 2025 compared to 2024 needs to be as high as about 19% to meet the expected target, while in reality, the growth rate in the first three quarters of 2025 is only 11%.
Finally, regarding nuclear power generation, according to the "14th Five-Year Plan" for Modern Energy System Planning, the operational installed capacity of nuclear power is expected to be 70 million kilowatts by 2025, and the utilization hours of nuclear power in 2024 are 7,683 hours. Therefore, the expected nuclear power generation in 2025 is about 537.8 billion kilowatt-hours.

**Based on the above basic data and related target assumptions, we can estimate that the current supply capacity of China's power system can reach 9,840.6 billion kilowatt-hours, which represents a year-on-year growth rate of 4.5% compared to the actual generation in 2024. As of September 2025, the cumulative year-on-year growth rate of electricity consumption is 4.6%, which is basically matched. However, since 2025, the growth rate of electricity consumption has continuously lagged behind the actual GDP growth rate, indicating that under the backdrop of anti-involution, the domestic situation is not as electricity-deficient as overseas (especially in the United States). Instead, compared to the period from 2022 to 2024, when the growth rate of electricity consumption significantly outpaced the actual GDP growth rate, there is a considerable amount of electricity redundancy **
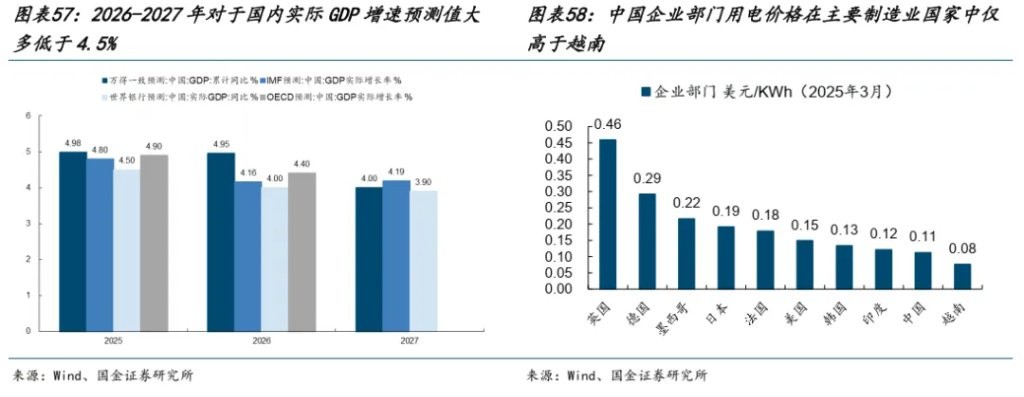
Looking ahead, based on different metrics for predicting domestic economic growth rates, it can be observed that the future supply capacity of the domestic power system can basically match the predicted values of actual GDP growth rates, and there may even be more redundancy. Additionally, the electricity prices for domestic enterprises have a strong comparative advantage among major manufacturing countries globally.
3 Analysis of Investment Opportunities Against the Background of Global Power Shortages: The Return of Physical Assets and the Re-evaluation of China's Production Capacity
Looking ahead, capital expenditures in AI are still being revised upward, so the demand expectations for electricity from AI will remain high. In addition, the recovery of global manufacturing will further bring about more electricity demand, meaning that power shortages are not limited to the North American region; global electricity demand may enter a period of rapid growth. However, China actually possesses absolute energy supply and price advantages globally, and there is currently no electricity shortage domestically, while manufacturing capacity is also quite ample. In the future, there will be a significant increase in demand for electricity and manufacturing/products that rely on electricity, and China's energy/manufacturing advantages will greatly benefit from the growth in global electricity demand. Based on the above logic, we recommend paying attention to:
(1) The growth in demand for related equipment brought about by the construction and improvement of the power system: energy storage/power equipment/gas turbines/SOFC/photovoltaics/wind power.
(2) The increase in physical consumption benefiting from the construction of the power system: upstream resources (copper, aluminum, lithium), steel, etc.
(3) Relevant raw materials that are in short supply due to rising downstream new energy demand and tight links in the industrial chain: membranes/lithium iron phosphate anodes/cathodes/lithium hexafluorophosphate, etc.
(4) Enterprises that are profitable and undergoing business transformation due to rising electricity prices: cryptocurrency mining farms.

4 Specific Investment Logic and Targets for Various Industries
4.1 New Energy & Machinery: The construction and improvement of the power system lead to increased demand for related equipment: energy storage/power equipment/gas turbines/SOFC/photovoltaics/wind power
(1) New Energy & Energy Storage: Transition from "deflation" to "inflation," the sector may welcome a "Davis Double Hit"
The current strong growth in energy storage demand mainly stems from the volatility challenges faced by the power system on both the supply and demand sides. On the supply side, the rapid increase in new energy installations has intensified grid fluctuations, leading to consumption bottlenecks in some regions, which has affected the progress of carbon reduction. Energy storage has become a necessary support. On the demand side, the rapid deployment of AI-driven data centers (AIDC) has led to a surge in electricity demand with significant fluctuations, placing considerable pressure on local grids and increasing the demand for flexible resources Under the joint drive of the "dual carbon" goals and the demand for AI computing power, the high prosperity cycle of the global energy storage market is expected to continue for more than five years, with traditional European and American markets and emerging markets forming a demand resonance. We estimate that the energy storage demand brought by AI in the United States from 2025 to 2028 will be approximately 18/59/143/279 GWh, and in Europe, it will be approximately 9/28/58/107 GWh, totaling 27/87/201/386 GWh, which corresponds to 10%/32%/74%/143% of this year's global energy storage installations.
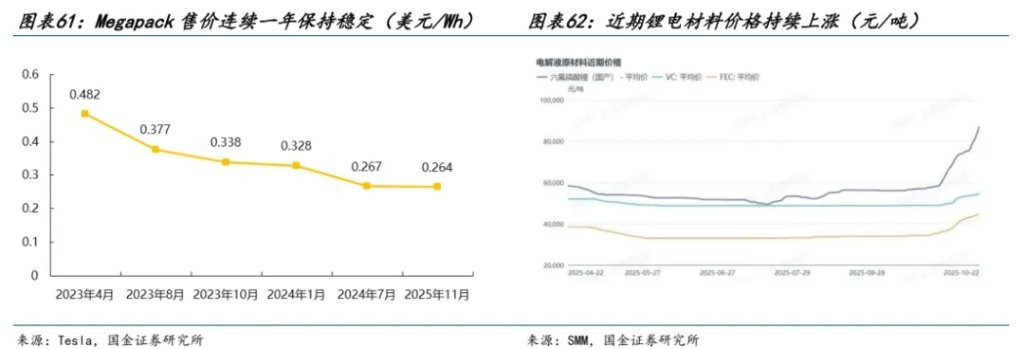
The main concern of the market regarding the energy storage sector has been the "deflation" logic, that is, the price of energy storage systems continues to decline with the falling cost of battery cells, suppressing corporate profitability. However, according to our tracking of Tesla Megapack's official website prices, the price of products of the same specifications has remained stable for 16 consecutive months. At the same time, due to the tightening supply and demand pattern, upstream raw material prices have rebounded, and the industry logic is shifting from "deflation" to "inflation," with profitability expected to recover, and the sector may welcome a "Davis double hit." It is recommended to focus on companies with strong supply chain security and leading overseas market layouts, such as Sungrow Power Supply, Canadian Solar, and Haisong Innovation.
(2) New Energy & Power Equipment: Focus on High Voltage and Medium-Low Voltage Exports
On the demand side, ① Power side: The installation of new energy sources has generated a large demand for supporting facility expansion; ② Grid side: The construction of power grids in developed countries in Europe and America is lagging behind & equipment is aging, with some equipment having been in operation for over 40 years. In addition, the United States is currently actively promoting re-industrialization, including the recent pull of AI data centers on grid load, significantly increasing the demand for grid construction.
On the supply side, the rapid development of new energy and data center projects has broken the original power grid investment planning. The supply chain construction of overseas large equipment manufacturers relies on the medium- to long-term plans of long-cycle customers, and expansion requires demand from large-scale long-cycle customers. Project-type customers like new energy or data centers lack a long-term cooperation foundation, making it difficult to secure production capacity. In addition, mainstream overseas power equipment manufacturers are constrained by supply chain bottlenecks, including potential gaps in silicon steel and copper, and shortages of electrical engineers and assembly workers, exacerbating the overall supply-demand imbalance.
In the early stages, Chinese power equipment export enterprises mainly targeted emerging markets in Asia, Africa, and Latin America. However, in recent years, more enterprises' qualifications, cost-effectiveness, and reputation have been recognized by key overseas countries, gradually breaking into developed markets. It is recommended to focus on high voltage side ( Siyuan Electric, Huaming Equipment, Shenma Power, TBEA etc.), and medium-low voltage side ( Jinpan Technology, Igor, Liangxin Co., Ltd. etc.).
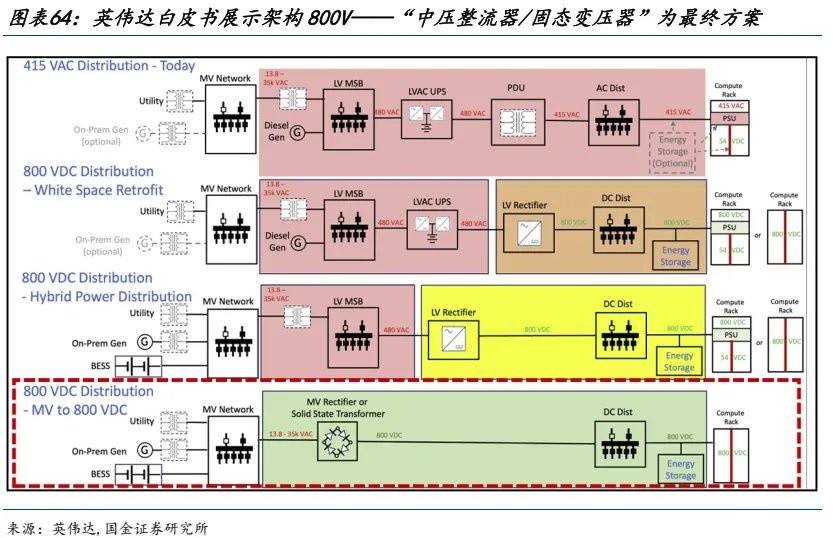
 ③Data Center Side: The core difference between the new generation of intelligent computing centers and traditional data centers lies in the power density reaching a quantitative change that triggers a qualitative change, necessitating significant reforms to the existing power supply architecture, clearly moving towards high-voltage direct current power supply. NVIDIA has explicitly endorsed SST as the ultimate solution. SST has very obvious advantages in efficiency, power density, control performance, and delivery cycle, and it is recommended to pay attention to Jingquanhua, Jinpan Technology, and Sifang Co., Ltd..
(3) Mechanical & Gas Turbines: North America's main power supply equipment, benefiting from AI catalysis and welcoming a demand explosion, the gas turbine industry chain is in short supply, focus on core components such as turbine blades.
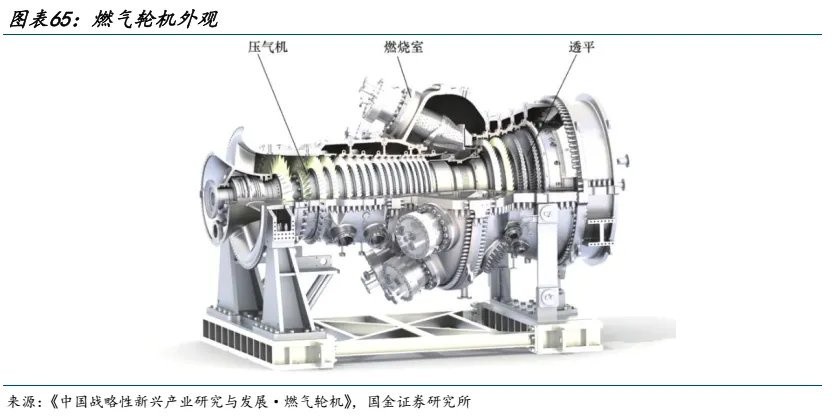
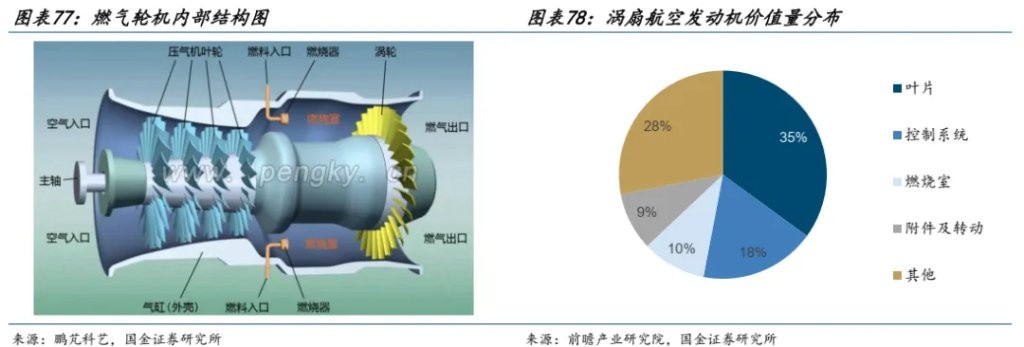
Gas turbines are rotary power machines that use continuously flowing gas as the working medium to convert thermal energy into mechanical work, including three core devices: compressors, combustion chambers, and turbines. The working principle is as follows: the compressor draws in air from the outside, and the air enters through the gas turbine's intake, where it is pressurized by the compressor blades and sent to the combustion chamber after compression. At the same time, fuel (gas or liquid fuel) is also injected into the combustion chamber through fuel nozzles, mixing with high-pressure air for combustion. The high-temperature, high-pressure flue gas generated from combustion expands after heating, flows through a guide and contacts the turbine blades, gradually expanding during contact, pushing the turbine blades to rotate the main shaft, thus achieving the conversion of thermal energy into mechanical energy.
Gas turbines are widely used in power generation, energy extraction and transportation, ships, and distributed energy systems. They are significant power equipment related to national security and the sustained growth of the national economy, hailed as the "crown jewel" of industrial manufacturing, and an important symbol of a country's advanced technological level, strong military strength, and comprehensive national power.
Gas turbines have superior performance and are widely used in power generation, industrial drives, and ship propulsion. Compared to diesel engines and steam turbines, gas turbines have advantages such as small size, compact structure; low noise, smooth operation, and low vibration; high single-machine power, high power-to-weight ratio, and good starting acceleration; low lubricating oil consumption, minimal maintenance, and fewer management personnel; high reliability and high availability. They are widely used in power generation, petrochemicals, natural gas transportation, as well as aviation, shipping, and railway transportation. Specifically, from the perspective of downstream applications, according to Guanyan Tianxia, power generation is the main application field for gas turbines, accounting for 32% of downstream applications; followed by the oil and gas sector, accounting for 29%, and other fields such as shipping accounting for 39%.
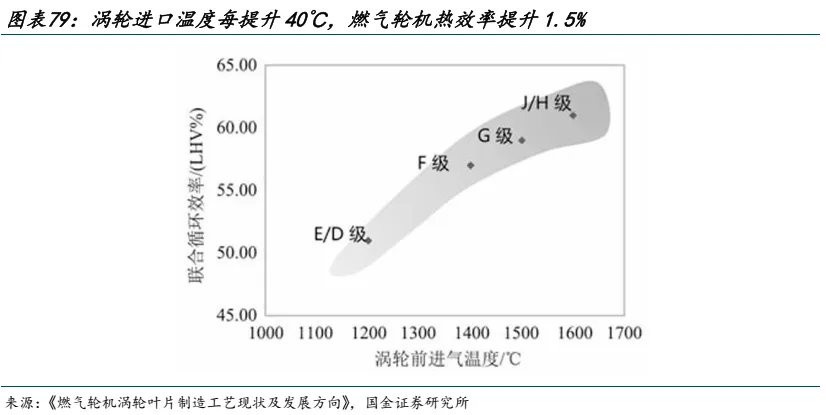
 Gas turbines can be classified into heavy-duty gas turbines, medium-duty gas turbines, and light-duty gas turbines based on their power range. Heavy-duty gas turbines are mainly used for urban power grids, medium-duty gas turbines are primarily used for industrial power generation, marine power generation, pipeline boosting, and tank locomotives, while light-duty gas turbines are mainly used for distributed generation. In addition, heavy-duty gas turbines can be classified by combustion temperature, with the inlet temperatures of E, F, G/H, and J class gas turbines being 1200℃, 1400℃, 1500℃, and 1600℃, respectively.

Gas power is the main power generation method in the United States. From 2016 to 2024, the proportion of natural gas power generation in the total power generation in the U.S. increased from 34% to 45%.
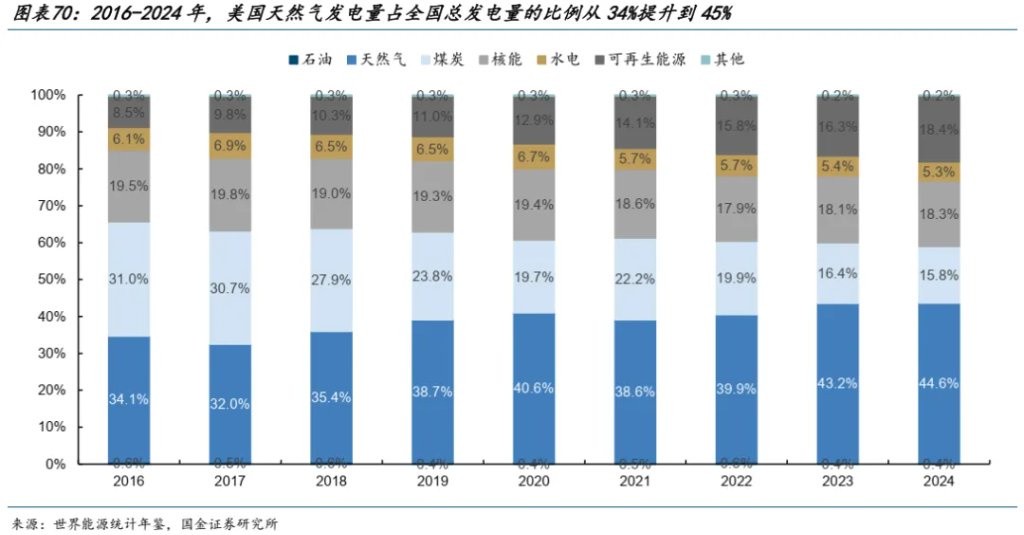
The construction of AI data centers is exacerbating global electricity consumption and catalyzing the demand for gas turbines. According to Gartner's forecast, the number of large data centers newly built globally to achieve generative AI is rapidly increasing, leading to a significant rise in electricity demand. From 2023 to 2027, the electricity consumption of global AI servers is expected to increase from 195 terawatt-hours to 500 terawatt-hours. We believe that gas turbine power generation, with its advantages of fast project construction speed, stable power generation, low cost, quick start-up, and low carbon emissions, is likely to become the core solution for power supply in the AI data center field. We are optimistic about the increase in the proportion of gas turbines in the data center power generation sector. By 2024, the proportion of gas turbines in the overall power generation structure in the U.S. is expected to rise to 45%. We believe that data centers are more suitable for using gas turbine power generation, and it is estimated that from 2025 to 2028, the proportion of gas turbines in the power generation structure of U.S. data centers will increase from 46% to 52%.
According to the calculations by the Guojin Electronics team mentioned above, it is expected that from 2025 to 2028, the power consumption of computing chips in U.S. data centers will increase from 7.1GW to 8.9GW. Considering the power consumption of cooling systems and other factors, computing chips account for about 80% of the total power consumption of the entire data center, leading to an increase in the total power consumption of U.S. data centers from approximately 8.9GW to 111.3GW. Based on the assumption of a gas turbine proportion of 46%-52%, the corresponding gas turbine demand will be 4.1GW-5.7GW, with growth rates of 219%/135%/88% from 2026 to 2028.
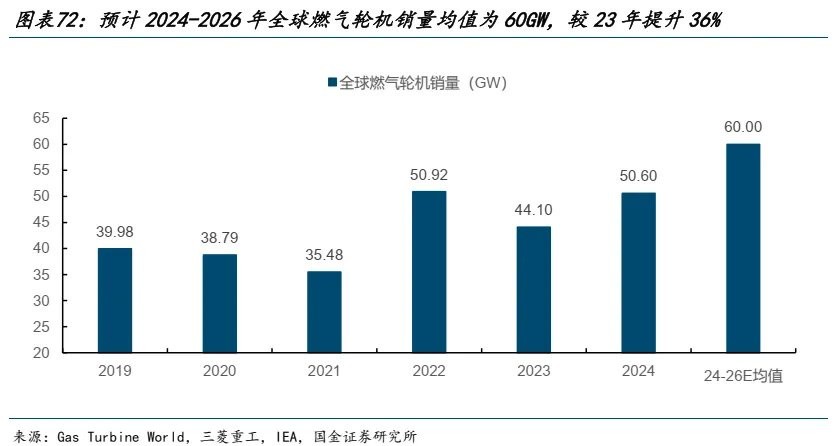
According to predictions from Gas Turbine World and Mitsubishi Heavy Industries, global gas turbine sales are expected to increase from 39.98GW in 2019 to 44.1GW in 2023, with a CAGR of 2.49%. It is anticipated that from 2024 to 2026, the average annual global gas turbine sales will be 60GW, representing a 36% increase from 44.1GW in 2023, indicating accelerated growth
Orders for gas turbine manufacturers are increasing significantly, but there is a severe global shortage of core components such as turbine blades.
Currently, the global gas turbine market is mainly dominated by companies such as Mitsubishi, Siemens Energy, and GEV, with a combined global market share of 81.64% in 2023. According to Gas Turbine World, the top three gas turbine manufacturers by new orders in 2023, based on power, are Mitsubishi Heavy Industries (35.6%), Siemens Energy (24.5%), and GEV (21.5%). According to McCoy Power Reports, Mitsubishi Heavy Industries holds a global gas turbine order share of 36% in 2023, ranking first in the world for two consecutive years, and occupies 56% of the heavy-duty gas turbine market (G, H, and J levels).

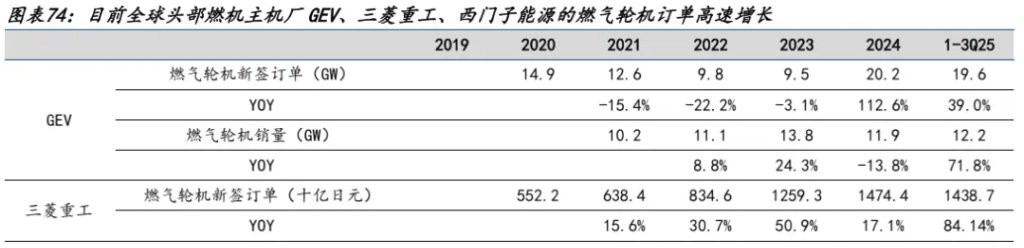
We find that against the backdrop of improving global gas turbine market conditions, leading overseas gas turbine manufacturers GEV, Siemens Energy, and Mitsubishi Heavy Industries share roughly three common points: high growth in gas turbine orders (reflecting high industry prosperity and strong demand in the gas turbine supply chain), high visibility of orders (reflecting overall tight capacity in the supply chain), and plans to expand gas turbine production capacity (which is expected to drive continued demand growth for upstream components such as turbine blades).
Common Point 1: High growth in orders. For example, GEV's new gas turbine orders for fiscal year 2024 are 20.2GW, a year-on-year increase of 113%. Siemens Energy's new order amount for gas services in fiscal year 2024 increased by 27%, accelerating growth. Mitsubishi Heavy Industries' gas turbine order amount increased by 17.1% in 2024, maintaining double-digit growth.

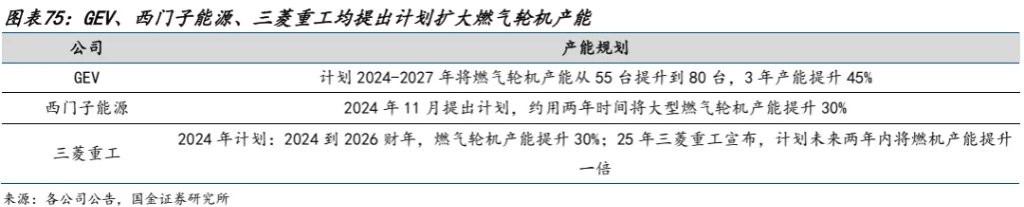
Common Point 2: Plans to expand gas turbine production capacity. In 2024, leading global gas turbine manufacturers such as GEV, Siemens Energy, and Mitsubishi Heavy Industries have all proposed expansion plans for gas turbine production. For example, GEV plans to increase its gas turbine production capacity from 55 units to 80 units between 2024 and 2027, a 45% increase over three years. Siemens Energy announced a plan in November 2024 to increase large gas turbine production capacity by 30% over approximately two years. Mitsubishi Heavy Industries plans to increase gas turbine production capacity by 30% from fiscal year 2024 to 2026 In 25 years, Mitsubishi Heavy Industries announced plans to double its gas turbine production capacity within the next two years.
Common Point 3: High visibility of orders.
According to GEV's announcement, as of the end of Q1-3 2025, GEV's power business has an order backlog of USD 84.06 billion. Based on the 2024 revenue of USD 18.1 billion for the power business, GEV's order visibility for the power business has reached 4.64 years. As of the end of Q3 2025, Siemens Energy's gas services segment has an order backlog of EUR 53 billion, and based on the 2024 revenue of EUR 10.8 billion, the current order visibility for Siemens Energy's gas services segment has reached 4.9 years.

Gas turbine blades are the core components of gas turbines, accounting for the highest value proportion. A gas turbine consists of three core components: compressor, combustion chamber, and turbine blades. In terms of value distribution, blades are the core components of gas turbines, with a high value proportion and significant manufacturing difficulty. For example, in gas turbines used in the aviation field (jet engines), the value proportion of blades is 35%, the highest. Next, the control system accounts for 18%, the combustion chamber for 10%, accessories and rotation for 9%, and other components account for 28%.
Gas turbine blades are divided into compressor blades and turbine blades, with turbine blades being the core components. The role of compressor blades is to compress gas through the flow channels formed between the blades, providing sufficient air for combustion in the combustion chamber. The role of turbine blades is to expand the high-temperature gas that has burned in the combustion chamber through the flow channels between the blades, converting thermal energy into mechanical energy. Turbine blades are key hot-end components in gas turbines, working continuously for long periods in high-temperature, high-corrosion environments and complex stress conditions. Currently, the mainstream turbine inlet temperatures for gas turbines are generally above 1300℃, approaching or exceeding the melting points of most alloys, and high-temperature alloys are typically used as the main material for turbine blades.
Turbine blades are core components of gas turbines, and their high-temperature resistance directly determines the performance of the gas turbine. According to "Current Manufacturing Processes and Development Directions of Gas Turbine Turbine Blades," the thermal efficiency and output power of gas turbines significantly increase with the rise in inlet temperature; for every 40℃ increase in turbine inlet temperature, the thermal efficiency of the gas turbine can increase by 1.5%, and the power correspondingly increases by 10%. Therefore, optimizing the comprehensive performance of turbine blades is key to improving the efficiency of gas turbines and extending their lifespan.
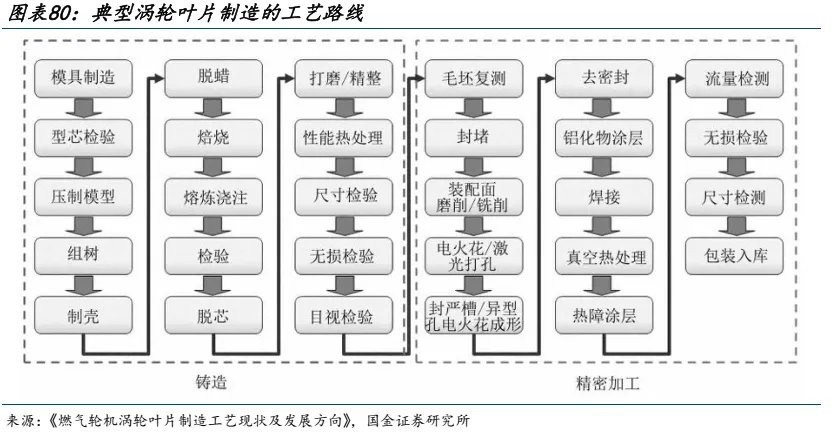
The technical barriers for gas turbine blades are relatively high. 1) In terms of material selection: The working environment of turbine blades is harsh, usually requiring long periods of operation under high temperature and high pressure, so high-temperature alloys are typically chosen as the manufacturing material. 2) In terms of manufacturing process: The manufacturing of turbine blades requires precise casting and machining techniques, with extremely small dimensional tolerances for the blade shapes; even slight deviations can affect performance. Therefore, the manufacturing process route for turbine blades is complex, with both casting and precision machining processes involving more than 10 steps, which contribute to the high added value of gas turbine hot-end turbine blades.
PCC and HWM are global leaders in gas turbine blades, with tight production capacity.
(1) PCC
PCC is a global leader in precision metal component manufacturing, established in 1953, primarily producing large, complex investment castings, blade castings, forged parts, metal materials, aerospace structural components, and fasteners for the aerospace sector, serving the aerospace, power, and general industrial markets. In January 2016, PCC was acquired by Berkshire Hathaway for $37.2 billion.
From a product business perspective, PCC has three main business segments: precision casting, forging, and airframe products. (1) In the precision casting segment, PCC mainly produces high-quality, complex investment castings for aircraft engines, industrial gas turbines, airframes, and other applications. In the aircraft and industrial gas turbine fields, PCC primarily produces hot components, including blades, rotors, shrouds, thermal barriers, and diffusers. (2) In the forging segment, the company produces nickel-based, titanium, and steel alloy components for the aerospace, industrial gas turbine, and general industrial markets; extruded seamless pipes for the energy market; and upstream metal products such as titanium alloys and nickel-cobalt alloys. (3) In the airframe products segment, PCC mainly produces engineering fasteners, fastening systems, metal parts, and components, serving the aerospace, transportation, power generation, and general industrial markets.
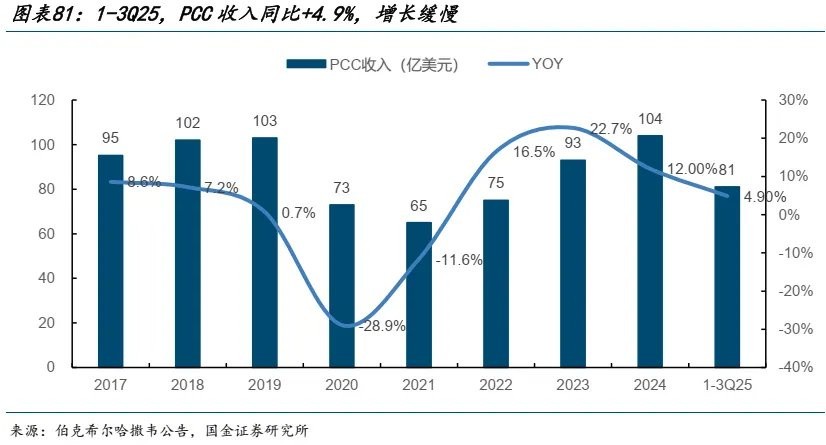
After 2019, PCC's revenue and production capacity fluctuated significantly, with no substantial growth. According to Berkshire Hathaway's annual report, from 2016 to 2019, PCC's revenue steadily increased to $10.3 billion. In 2020-2021, due to the impact of public health events, demand for aerospace products declined, with PCC's employee count dropping by 40% year-on-year in 2020, achieving revenue of $7.3 billion, a year-on-year decrease of 28.9%, and a significant decline in production capacity. After 2022, as aerospace demand gradually recovered, the company's revenue slowly began to grow again, reaching $10.4 billion in 2024, showing no significant substantial growth compared to 2019 levels. In 2025, under a significant upturn in industry demand, the company's revenue growth rate in Q1-Q3 2025 was only 4.9%, indicating a slowdown, and PCC's production capacity remains tight
(2) Howmet
Howmet Aerospace is a leading provider of components for the global aerospace, industrial, and transportation industries and is one of the first companies in the world to produce structural castings for aircraft engines. Founded in 1988, it underwent several transformations and was renamed Howmet on April 1, 2020.
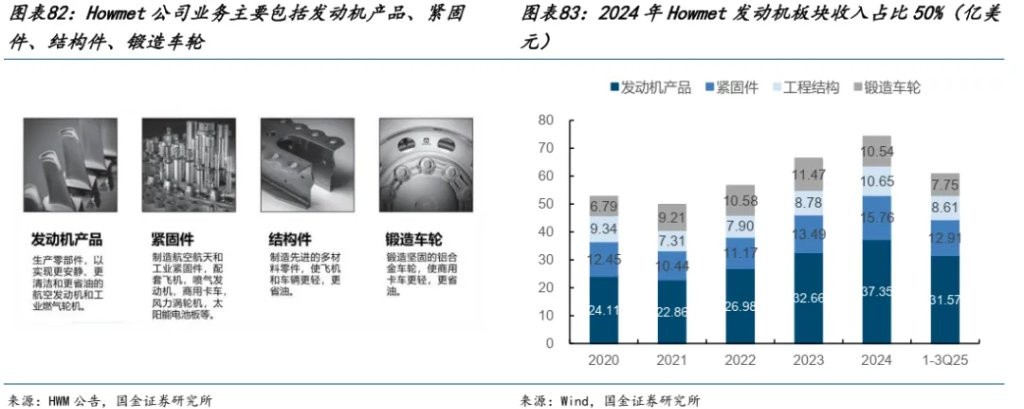
Howmet has four main business segments: engine products, fastening systems, engineered structures, and forged wheels. 1) The engine segment primarily provides blades and seamless rolled rings for aircraft engines and industrial gas turbines, as well as rotating and structural components. 2) The fastening segment produces aerospace fastening systems, as well as fasteners for commercial transportation, industrial, and other applications. 3) The engineered structures segment provides titanium ingots and rolled products, aluminum and nickel forgings for aerospace and defense applications; it also offers titanium forgings, extrusions, and forming and machining services for fuselages, wings, and aircraft engines. 4) The forged wheels segment provides forged aluminum wheels for the heavy truck and commercial transportation markets. In 2024, Howmet's total revenue is projected to be $7.43 billion, with the engine segment accounting for $3.735 billion, or 50.3%.
According to Howmet's announcement, after the spin-off completed in 2020, the company's fixed assets significantly declined. Since 2020, the net fixed assets of the company have remained stable without significant expansion, and the company's capital expenditures have also remained at a low level. Against the backdrop of a surge in demand in the gas turbine industry, the two major turbine blade leaders globally have not shown significant capacity expansion, leading to a severe shortage of global blade capacity.

Yingliu Co., Ltd. is the domestic leader in turbine blades, and future blade orders are expected to continue to grow significantly. The company is the domestic leader in gas turbine blades, with a technology level that is leading in the country. Currently, the company has developed hot-end products for various models of gas turbines, including E/F/H/J grades, with a power range covering major models from 12MW to 400MW, and its customer base includes major global gas turbine giants. The product range includes high-temperature alloy single crystals, directional and equiaxed crystals of various moving blades, guide blades, and shrouds; based on the mass production and delivery of directional hollow turbine blades for domestic large F-class heavy gas turbines, higher-level G/H-class turbine blades have also achieved a technological breakthrough in May 2024, passing acceptance by industry experts. In April 2025, the castings for the second-stage moving blades of a certain type of heavy gas turbine undertaken by the company passed the first piece identification, marking another phased achievement in the national gas turbine major project and further solidifying the company's leading position in the domestic market The number of new gas turbine orders signed in 2024 is relatively high, and contract liabilities have significantly increased, optimistic about the company's long-term revenue growth. According to the company's announcement, as of September 30, 2024, the company's gas turbine backlog is approximately 800 million yuan, with new orders signed in August and September alone reaching 400 million yuan. The year-on-year growth of new orders in the gas turbine sector in 2024 reached 102.8%. By the end of Q3 2025, the company's contract liabilities reached 206 million yuan, a year-on-year increase of 20%, and it continues to reach new highs quarter-on-quarter. The company currently has a large backlog of orders and is optimistic about the long-term revenue growth of its gas turbine business.
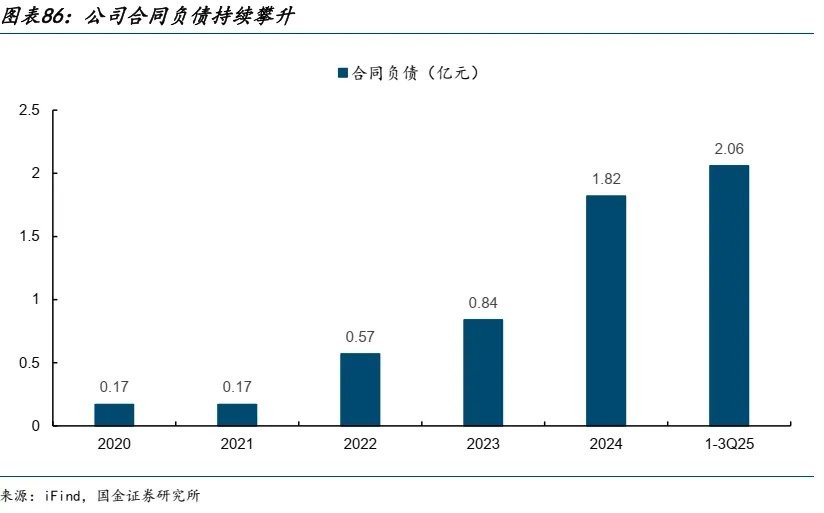
(4) Electric New Energy & SOFC: Focus on leading system companies and related supply chains
Bloom Energy is the global leader in the SOFC industry and was the first to win the core bid for the AI data center in the United States.
The technical foundation of Bloom Energy's products is SOFC, with the main products being the Bloom Energy Server (SOFC) and Bloom Electrolyzer (SOEC). Bloom Energy's fuel cell systems can receive tax deductions and state-level subsidies in the United States. Between 2001 and 2015, Bloom Energy's customers in California received a total of 230 million dollars in subsidies. The company's technology is relatively mature and has good operational reliability, with its developed SOFC flagship product specification being a 50kW module, which can be combined in multiple modules to achieve fuel cell systems of several megawatts.

Technological iteration + continuous volume increase, product costs are rapidly declining. In recent years, the company's product prices have continuously decreased, with the average selling price of products in Q3 2024 being approximately 3,170 dollars/kW, and costs at 2,075 dollars/kW, representing a decrease of 57% and 62% in selling price and cost respectively compared to Q3 2020, declining at an annual rate of about 10%-15%. 52% of the products are used domestically in the United States, and 48% are exported overseas, such as to South Korea and Japan. The company's revenue in Q3 2025 was 519 million dollars, a year-on-year increase of 57%; adjusted gross margin was 30.4%, a year-on-year increase of 5.1 percentage points; adjusted EBITDA was 5.9 billion dollars, turning profitable year-on-year, with positive customer delivery progress. It is expected that the development speed of the SOFC industry will continue to exceed expectations, and the company, as a leading manufacturer, will fully benefit.
 The company's product shipment exceeded 1.2GW, collaborating with leading companies in multiple fields. With endorsement from Oracle, it will quickly break through AI data center orders. The company is located in California and contributes 60% of the state's stationary fuel cell systems, having sold and installed 1.2GW of SOFC products in 8 countries worldwide. In response to the enormous demand from data centers, the company is actively expanding production capacity, which will not become a bottleneck for development. It plans to expand capacity to 2GW by December 2026, sufficient to support four times the revenue of 2025. Furthermore, the company's performance is expected to continue exceeding expectations, with financial indicators for 2025 projected to outperform previously announced annual guidance, costs continuing to achieve double-digit reductions, and profit margins continuing to improve.
The company participates in AI project construction through seven methods: 1) Hyperscalers: directly supplying Oracle; 2) Power companies: indirectly supplying AWS through AEP; 3) Natural gas suppliers: indirectly supplying third-party hyperscalers; 4) Colo (colocation service providers): the company supplies IDC manufacturers represented by Equinix; 5) NeoClouds: providing on-site power for CoreWeave, a provider for NeoCloud, at its high-performance data center in Illinois; 6) Data center developers; 7) Infrastructure investors: for example, Brookfield, which has invested $50 billion in AI and plans to double its AI strategy scale in the next three years, has made an initial investment of $5 billion with Bloom Energy and will announce a Bloom-powered AI inference data center project in Europe by the end of this year.

SanHuan Group: Core supplier of Bloom Energy's membrane.
SanHuan Group has become a major supplier of SOFC electrolyte membranes and SOFC single cells globally, leading the national key R&D program for SOFC stack engineering development. SanHuan Group is one of the earliest companies in China to research and produce SOFC, with the largest shipment of electrolyte membranes and single cells, while also possessing mass production capabilities for stacks. The systems are primarily produced by its subsidiary CFCL at its production base in Germany, focusing on 1.5kW systems. Currently, Chaozhou SanHuan is the largest supplier of SOFC electrolyte membranes globally (supplying Bloom Energy) and the largest supplier of SOFC single cells in the European market.
The company began developing and producing SOFC electrolyte membranes in 2004; started mass production of SOFC single cells in 2012; acquired Australian CFCL in 2015, gaining its stack and small power SOFC system technology foundation; and in 2016, licensed SOFC patents for use by SOLIDpower and supplied single cells to them Since 2017, SOFC stacks have been launched in the domestic market. In 2022, a demonstration system composed of three 35KW modules successfully operated as a 100KW system. In January 2023, the "210kW High-Temperature Fuel Cell Power Generation System R&D and Application Demonstration Project," conducted in cooperation with Guangdong Energy Group Co., Ltd., successfully passed acceptance at Guangdong Huizhou Natural Gas Power Generation Co., Ltd.
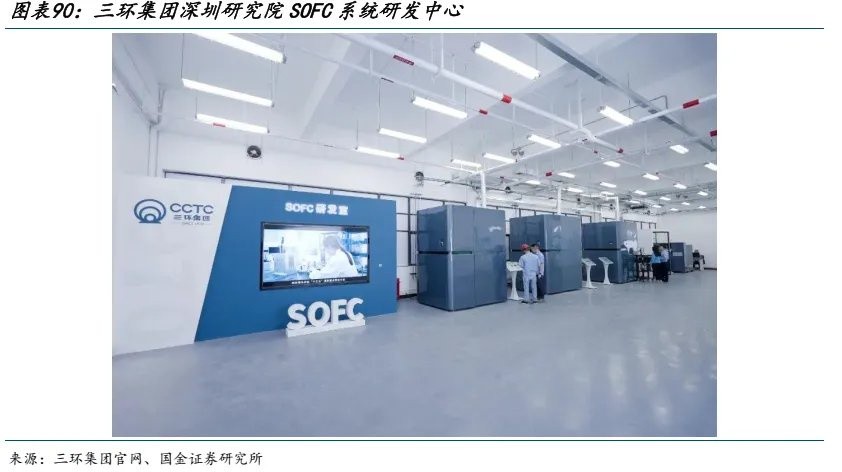
Weichai Power: Acquired equity in Ceres Power, achieving demonstration applications of products.
In May 2018, Weichai Power strategically invested in the globally leading SOFC technology company Ceres Power in the UK, becoming its largest shareholder, and established a joint venture in Weifang, China, to engage in comprehensive cooperation in the field of solid oxide fuel cells. The joint venture will use Ceres Power's SteelCell technology to produce and sell fuel cell systems, stacks, and cells for use in buses, trucks, and specific power generation markets. Currently, Weichai Power has achieved engineering breakthroughs in SOFC technology and mastered key core technologies of the new generation SOFC. Its 120KW product released in February 2023 is the world's first high-power metal-supported SOFC, with a net power generation efficiency exceeding 60% and a combined heat and power efficiency reaching 92.55%, the highest globally among large SOFC systems.
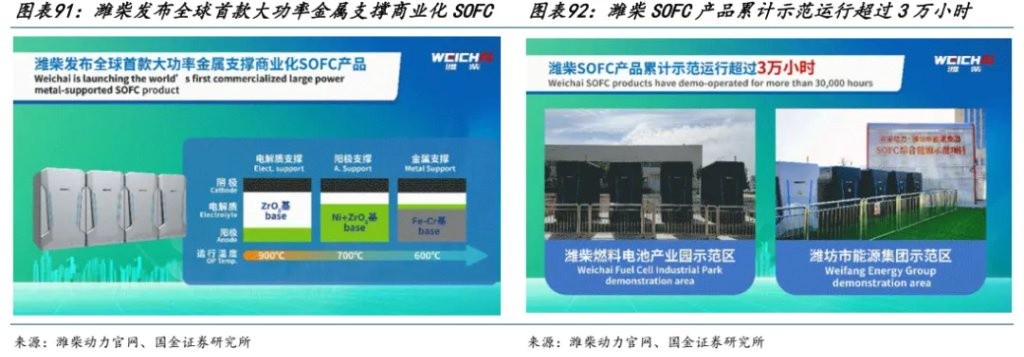
Yishitong: Integrated construction of SOFC systems to form a scaled production line.
Yishitong is a leading player in the global barium titanate industry for lithium batteries, with main products including new energy lithium battery coating materials, electronic communication functional filling materials, and low-smoke halogen-free flame retardant materials. In recent years, Yishitong has entered the hydrogen sector, laying out new products in the field of carbon reduction and carbon fixation technology, targeting a second venture in solid oxide fuel cells (SOFC). In October 2022, Yishitong announced plans for its wholly-owned subsidiary, Anhui Yishitong Material Science Research Institute Co., Ltd., to serve as the implementation entity for the Yishitong Operation Center project, with a total investment expected to be nearly 400 million yuan; in February 2023, it initiated the co-construction of a "Solid Oxide Fuel Cell Joint Laboratory" with the Advanced Technology Research Institute of the University of Science and Technology of China, dedicated to achieving zero-carbon cycles and the resource utilization of carbon dioxide; in December 2023, the company commenced construction on a solid oxide energy system project in Nankang, Hefei, with a total investment of approximately 1.21 billion yuan, a construction period of three years, and an annual production capacity of 1GW for solid oxide energy systems (including SOFC and SOEC) (V) New Energy & Photovoltaics
The explosive development of AI technology is driving global data centers into a phase of large-scale expansion, especially in core technology regions represented by the United States. The intensive operation of AI Data Centers (AIDC) is bringing about exponential growth in electricity demand. Photovoltaics, as a mature technology with a short deployment cycle and strong flexibility, can be quickly implemented without complex pipeline installations. When combined with other energy sources such as wind power and natural gas, it forms a complementary system that can efficiently fill the electricity gap and provide reliable support for the stable operation of data centers. At the same time, considering ESG requirements, the "photovoltaics + energy storage" system is increasingly becoming an important supplementary power source for AIDC in the United States or a key choice for power supply through the PPA model.
Although the large-scale deployment of photovoltaics is constrained by land, initial investment, and regional sunlight resources, the rigid electricity demand brought by AI data centers, combined with policy support and declining technology costs, will continue to release the potential of photovoltaics. Based on a comprehensive assessment of the growth trends in the AIDC industry in the United States, the development pace of photovoltaic technology, and the policy environment, we predict that approximately 20% of the new electricity demand from 2025 to 2028 for AIDC in the United States will still be met by photovoltaic power generation, estimating new photovoltaic installations of 7/21/45/78GW.
Considering the support of trade policies such as the "Big and Beautiful" Act for the domestic supply chain in the United States, it is expected that companies with core supply capabilities such as overseas battery cells will fully benefit. Recommended: Junda Co., Ltd., Canadian Solar, JA Solar Technology.
(VI) New Energy & Wind Power
Driven by electrification and data center demand, electricity demand in Europe is expected to return to growth. Against the backdrop of energy independence demands, governments in various countries are accelerating the bidding for offshore wind projects. In the context of high industry demand growth, the supply of domestic pipe piles, submarine cables, and other segments is insufficient to meet the strong demand. We are optimistic about leading domestic pipe pile, submarine cable, and wind turbine companies achieving breakthroughs in European orders. Key recommendations: Dajin Heavy Industry, Dongfang Cable, Mingyang Smart Energy.
4.2 Non-ferrous Metals: Accelerated Investment in Data Centers, Renewed Demand for Copper and Aluminum
Starting from 2025, copper supply is expected to shrink significantly, while demand is performing stronger than expected, showing characteristics of low supply and strong demand overall.
On the supply side, the production disclosures of mainstream mining companies for Q3 2025 have basically concluded, showing a year-on-year decline of 160,000 tons and a quarter-on-quarter decline of 100,000 tons. In the next three quarters, until Q2 2026, the year-on-year decline will continue, leading to sustained supply tightness.
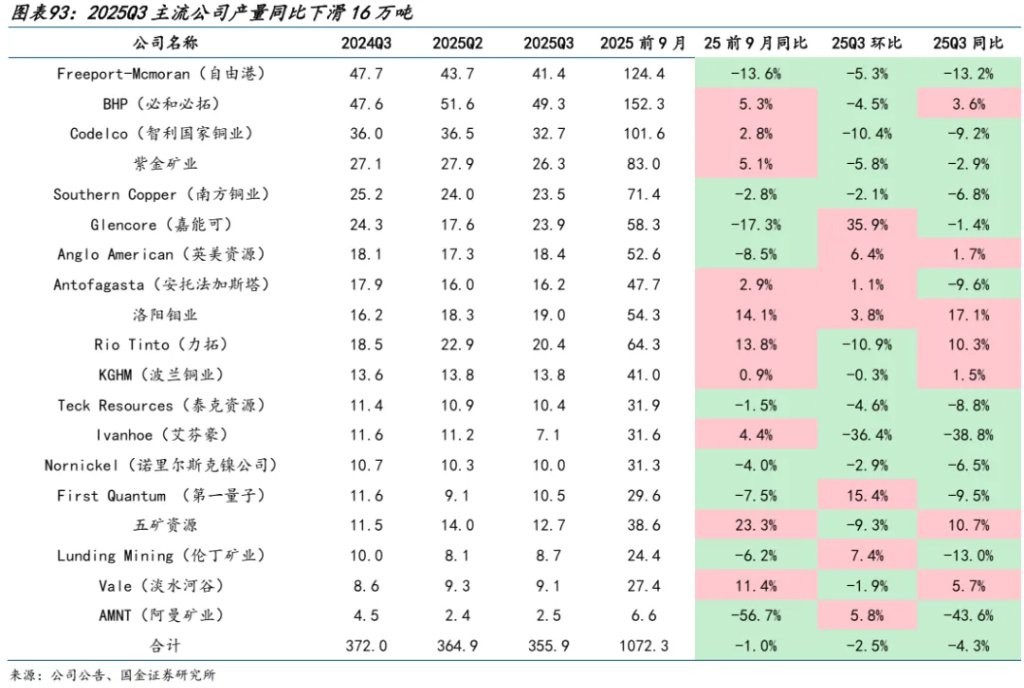
The demand pull for copper and aluminum from data centers is a reality rather than a narrative. Data from the first seven months of 2025 shows that the demand for copper from the power grid in Europe and the United States has already become evident. From the perspective of material flow, we observed that the import of electrical equipment in the United States in the first seven months was 219,000 tons. Except for the weakness in other products after a rush to export in the grid category, the remaining products showed a decrease of 2,000 tons, and all new imports of copper products in the United States came from electrical equipment. The annual import of power equipment is nearly 400,000 tons, contributing to a global demand growth rate of 1.5%.**
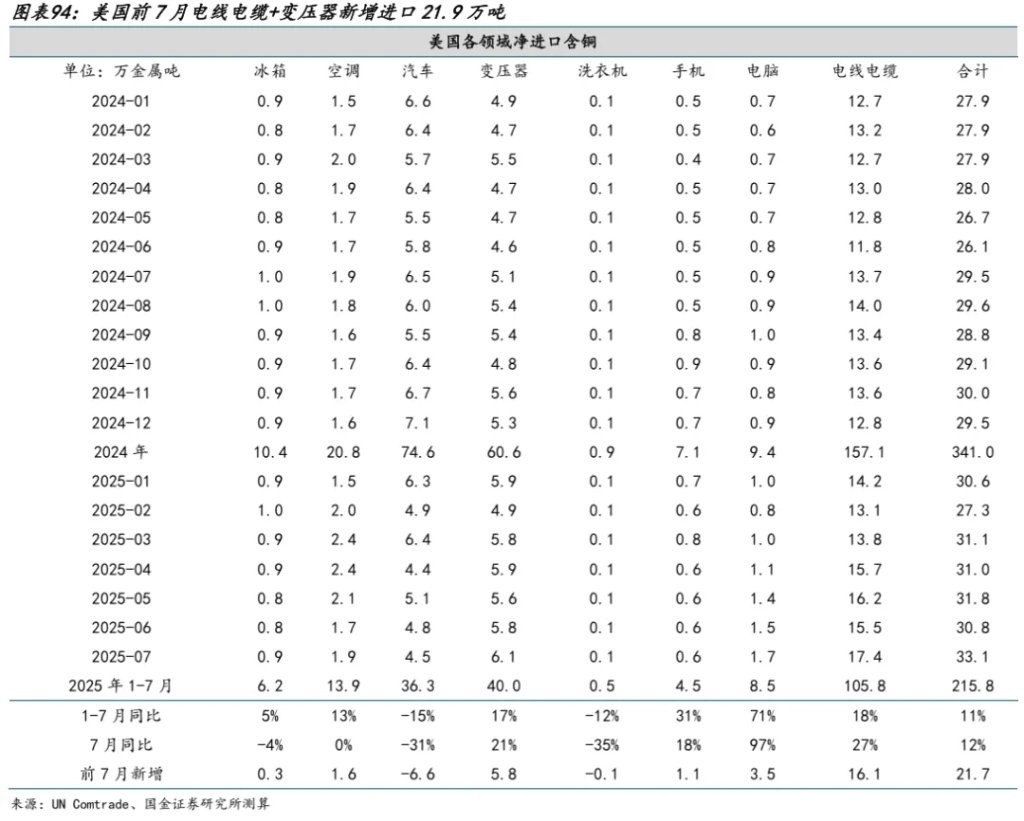
Similar to Europe and the United States, the new demand for power equipment in the first eight months of this year was 108,000 tons, accounting for 71% of the increase in copper product imports in Europe, with an expected annual increase in power demand of nearly 200,000 tons. The combined new demand for power grids in Europe and the United States is 600,000 tons, fully reflecting the recovery of overseas manufacturing and the pull of AI on power demand. However, this year, the supply side has failed to release the expected increase, leading to a significant copper shortage by 2025.
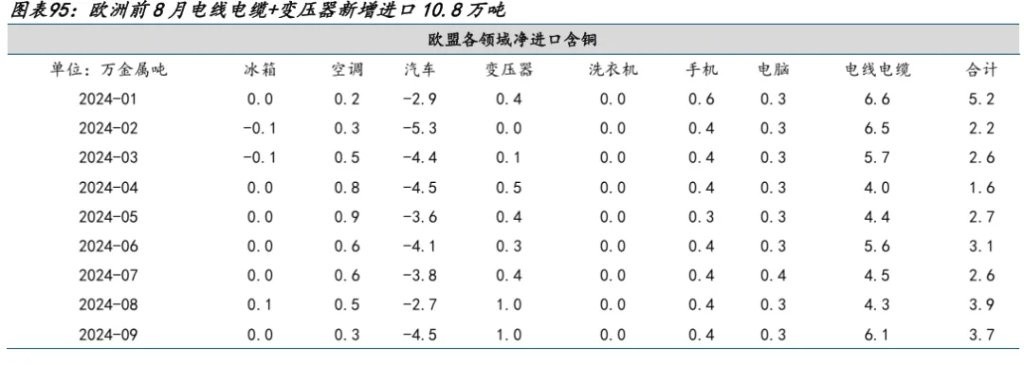
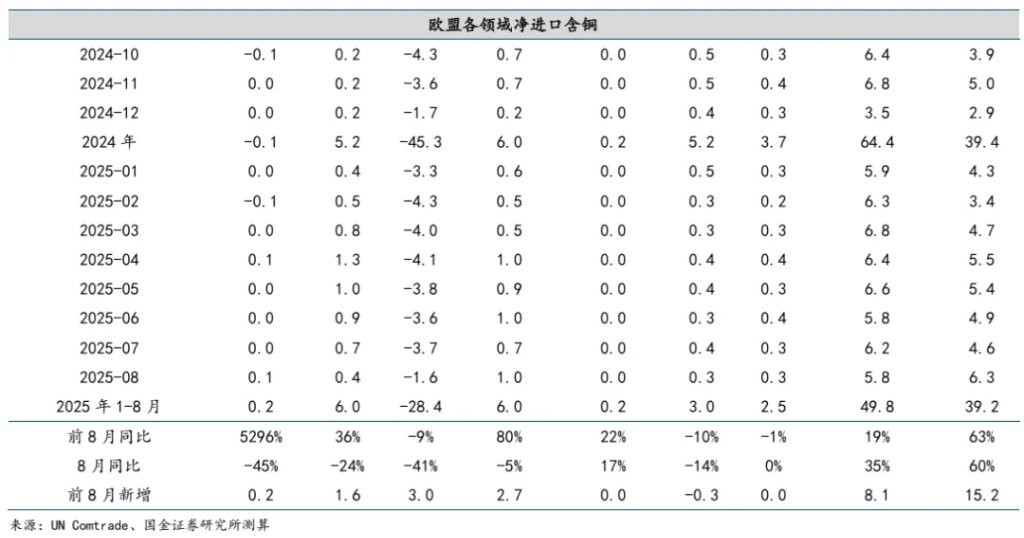
In the above text, we calculated the demand for copper and aluminum driven by data centers through material flow. Next, we will discuss the long-term demand.
The demand section will be discussed and analyzed in conjunction with the "2024 United States Data Center Energy Usage Report" (hereinafter referred to as the report).
According to the report, we distinguish the pull of AI on power into two stages:
Historical Trends (2014-2023) 2014-2016: Power consumption remained stable at about 60 terawatt-hours (TWh) per year, continuing the low growth trend since 2010.
1) 2017 Turning Point: With the growth in server installations, especially the significant increase in the share of graphics processing unit (GPU) accelerated servers used for artificial intelligence (AI) in the stock of data center servers, power consumption in data centers began to rise; in 2018, consumption reached about 76 TWh, accounting for 1.9% of the total annual power consumption in the United States.
2) 2018-2023: The growth rate accelerated, with power consumption reaching 176 TWh in 2023, accounting for 4.4% of the total power consumption in the United States, and a compound annual growth rate of 18% from 2018 to 2023.
Future Scenario Forecast (2024-2028) The forecast range for 2028: Power consumption is expected to be as low as 325 TWh and as high as 580 TWh. Assuming an average capacity utilization rate of 50%, the total power demand for data centers corresponds to 74-132 gigawatts (GW), accounting for 6.7%-12.0% of the projected total power consumption in the United States in 2028, with a compound annual growth rate expected to be 13%-27% from 2023 to 2028
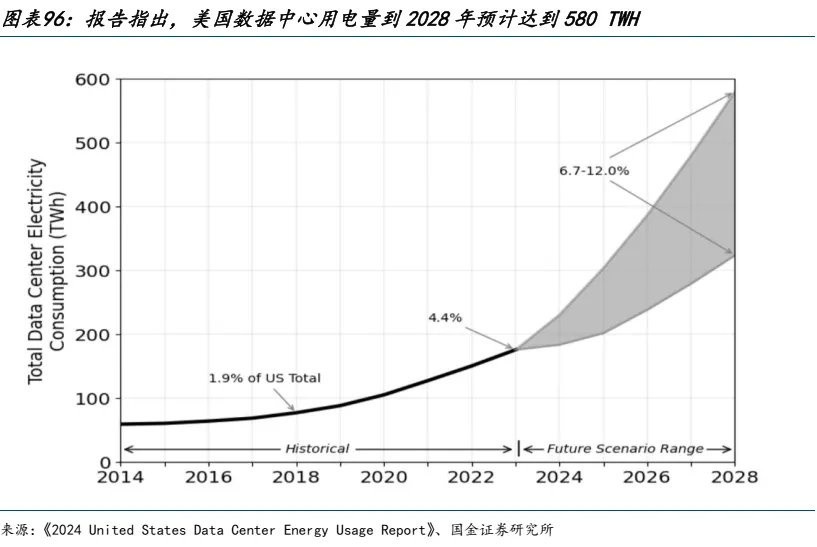
In terms of electricity consumption, the report is based on GPU shipment volumes combined with the overall system's power consumption per unit, calculating the overall data center electricity consumption. Therefore, we will discuss GPU shipment volumes and system power consumption per unit.
Electricity is an inflationary factor, adjusting the assumptions for overall system power consumption per unit. The AI 8 GPU cabinet used in the report is represented by the 8×H100 DGX H100 product. According to NVIDIA's official "DGX H100/H200 User Guide" power specifications, the maximum power consumption does not exceed 10.2kW. Currently, the mainstream product in the market is the NVL 72 (GB200) cabinet, which, according to Supermicro's NVL72 datasheet, has a power consumption of 125-135kW. The number of GPUs in the NVL 72 cabinet is 9 times that of the AI 8 GPU. If electricity were not an inflationary factor, the power consumption would also be expected to be around 9 times. However, in actual operations, the power consumption is about 12-13 times, indicating significant electricity inflation. We believe the core issue lies in the power inflation of the cooling system. As subsequent cabinet iterations continue, if there is no further iteration of the cooling system, the power consumption at the cooling system end will remain in an inflationary state.
AI continues to thrive, raising GPU shipment volume assumptions. The report uses IDC 2023a and IDC 2024b's "Data Center GPU Shipment Volume" as upper and lower bounds to construct GPU shipment scenarios for 2024-2028. The new version (2024b) is higher due to enhanced AI activities in the second half of 2024; the lower bound assumes that the strength of H2'24 does not continue, and the growth rate returns to the old trajectory. By the end of 2024, AI server/GPU shipments are expected to be below expectations, with significant increases in Blackwell/GB200 shipments starting only in 2Q25; at the same time, advanced packaging (CoWoS) will significantly expand production in 2025, and OEMs will report strong orders and backlogs in 2025Q2. Multiple sources corroborate that H1'25 (especially Q2) is stronger than H2'24, thus supporting our judgment to raise the overall GPU shipment forecast for 2025H1.
Based on the above assumption adjustments, we conservatively raise our future shipment volume expectations and overall power consumption by 20%. Ultimately, we revise the data center electricity consumption assumption in the report from 580TWH to 835TWH.
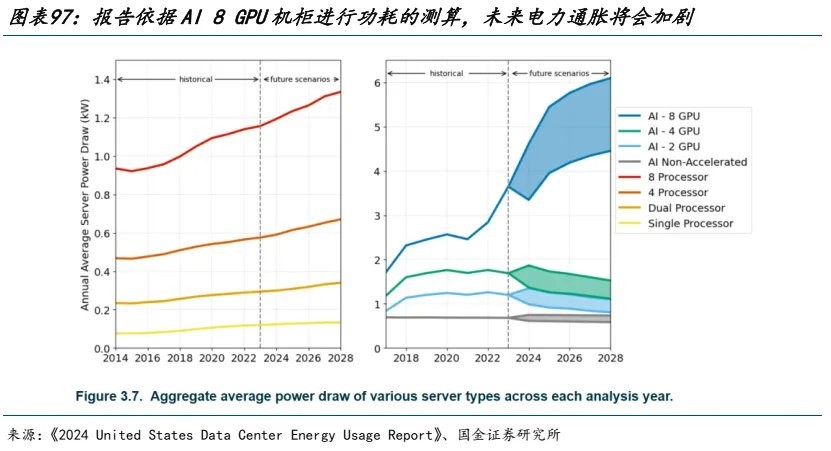
The above is our discussion on data center electricity consumption. Next, we will discuss material consumption based on the material flow model of the power grid The core assumption of the material flow in the power grid is that the growth rate of electricity consumption in the United States is basically synchronized with the current growth rate of power generation and transmission and distribution construction. Under the operation of the load on the power generation and transmission and distribution sides in the United States, we see a significant rise in electricity prices, reflecting the extreme tension in the current U.S. electricity supply. Therefore, we assume that if the U.S. wants to meet new electricity demands, it needs to advance the construction of power generation and transmission and distribution. Before the construction of power generation and transmission and distribution is completed, electricity will temporarily become a bottleneck for the expansion of data centers.
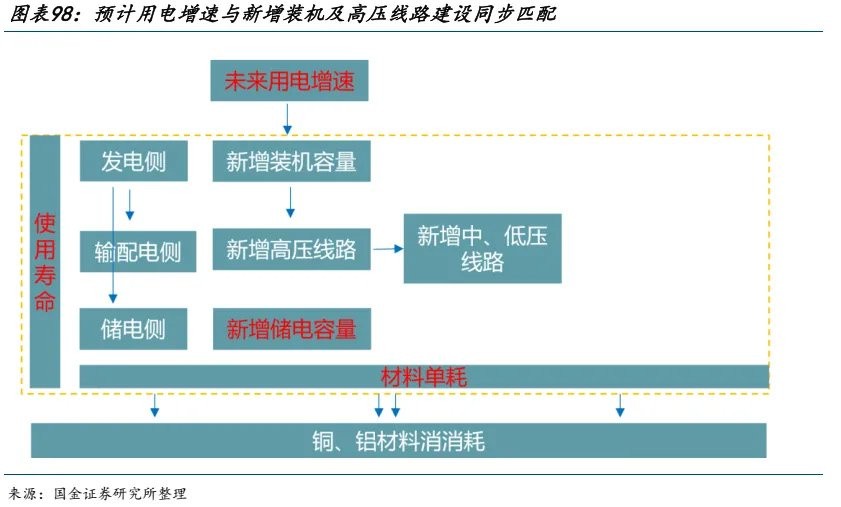
The demand for copper driven by AI data centers mainly affects electricity consumption. In 2023, the electricity consumption in the United States is 4,000 billion kilowatt-hours. According to the Berkeley Lab mentioned above, the electricity consumption of data centers in 2023 is 176 billion kilowatt-hours, accounting for 4.4% of total U.S. electricity consumption. Based on our revised forecast of the report, by 2028, electricity consumption will be as low as 580 billion kilowatt-hours and as high as 800 billion kilowatt-hours, contributing an additional electricity consumption of 404-624 billion kilowatt-hours, totaling a contribution of 10%-15.6% to new electricity consumption. By 2028, the contribution of AI data centers to electricity CAGR is about 2%-4%. We assume that the electricity CAGR in other sectors outside of AI data centers, such as manufacturing reshoring and new energy, is around 1.5%-2%, so we expect the overall U.S. electricity CAGR to be around 4-6%.
In this scenario, we estimate the demand for copper and aluminum in the U.S. power grid. By 2030, the demand for copper and aluminum driven by data centers, manufacturing reshoring, and new energy will increase by 2.1 million tons and 3.71 million tons, respectively, compared to 2025. From the product structure perspective, the demand for copper is mainly driven by wires, cables, and transformers, while aluminum is mainly driven by wires, cables, and substations.
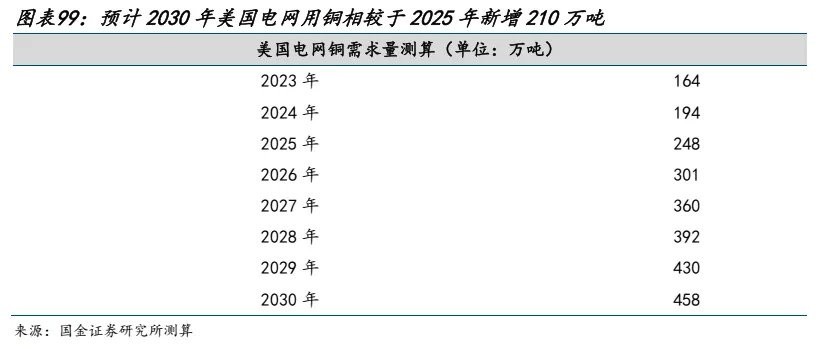
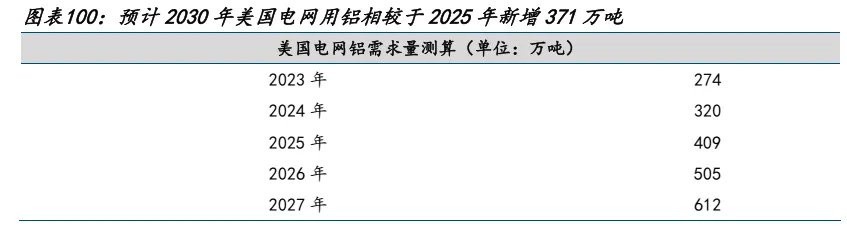
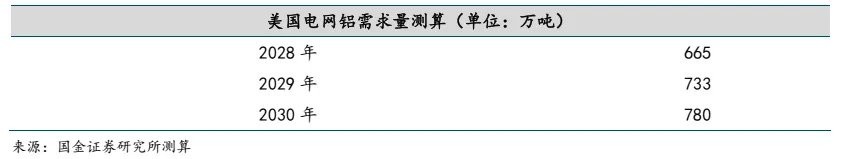
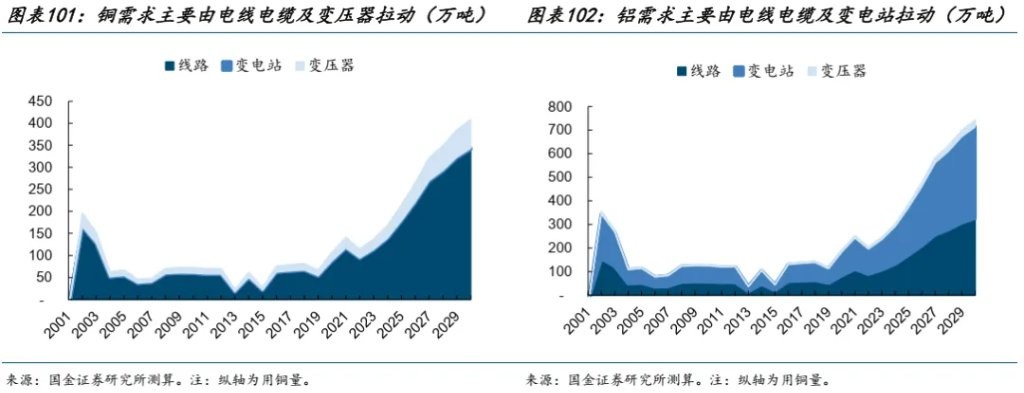
**The current market supply-demand balance table for copper and aluminum does not consider the demand driven by data centers. Even in a conservative scenario that does not take data centers into account, copper and aluminum have already entered a state of shortage in terms of supply and demand. If we consider the demand for copper and aluminum driven by U.S. data centers, the supply gap for copper and aluminum will further widen, and both copper and aluminum prices will show stronger performance **

4.3 Cutting-edge Technology: Focus on Actively Transforming AI Data Centers and Stagnant Cryptocurrency Mining Companies
(1) Iris Energy: Holds a Large Number of NVIDIA Blackwell GPUs, Provides AI Cloud Services
Iris Energy was established in Australia in 2018 and went public on NASDAQ in 2021. Unlike most transformed cryptocurrency mining companies that only provide AI data center leasing services, Iris Energy procures GPUs itself and offers AI cloud services.
In the third quarter of 2025, the company's operating revenue was $240 million, of which AI cloud service revenue was $7.34 million, accounting for 3.1%. Since the third quarter of 2025, the number of GPUs procured by the company has rapidly increased, reaching 23,000 GPUs by September 2025, which are expected to be put into operation in the first quarter of 2026, corresponding to approximately $500 million in ARR (Annualized run-rate revenue). The average contract duration is 2 years, with an average pricing of approximately $2.33/GPU/h.
Iris Energy disclosed the composition of the 23,000 GPUs on hand. As a preferred partner of NVIDIA, the company owns 19,100 NVIDIA B200 and B300s, 1,900 NVIDIA H100 and H200, 1,200 NVIDIA GB300, and 1,100 AMD MI350Xs, with an average procurement price of approximately $53,000/GPU.
Assuming a conversion of 60,000 GPUs corresponding to 160MW, the 23,000 GPUs are expected to correspond to 61.3MW. Assuming an electricity price of 4.8 cents/kWh and a total of 8,760 hours of GPU operation per year, with GPUs depreciated over 3 years, the annual operating cost (including depreciation) for the 23,000 GPUs is approximately $440 million.
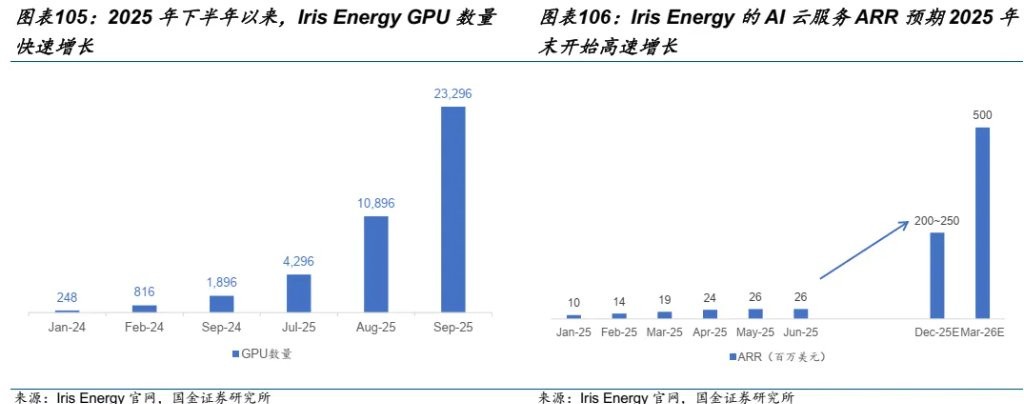
In October 2025, the company signed a 5-year AI cloud computing leasing contract with Microsoft to lease NVIDIA GB300 chips, with billing starting in 2026. The total contract amount is $9.7 billion, with an ARR of approximately $1.94 billion. This contract corresponds to a critical IT load of 200MW, requiring the procurement of $5.8 billion in GPUs; Microsoft prepaid 20% of the amount to offset the rent for years 3 to 5.
The company plans to purchase approximately 140,000 GPUs by 2026, with an ARR of $3.4 billion, corresponding to 460MW. The company currently has 2,450MW of power capacity, and if the total power capacity of 2,910MW is used for AI data centers, it could correspond to an ARR of $21.5 billion.
(II) Core Scientific: Pioneer in AI Data Center Transformation, Deep Cooperation with CoreWeave
Core Scientific is one of the early adopters of AI data center transformation in the cryptocurrency mining industry, having started hosting GPUs for CoreWeave as early as 2019. After successfully navigating bankruptcy risks in January 2024, the company signed a contract with CoreWeave in March of the same year for a scale of 16MW, with potential total revenue exceeding $100 million, marking the starting point of its transformation from a cryptocurrency mining facility to an AI data center.
In June 2024, the company signed a 12-year 270MW HPC hosting contract with CoreWeave, which is expected to bring the company over $4.725 billion in cumulative revenue. The company anticipates a profit margin of about 80% for this project, with 200MW expected to be operational in the first half of 2025 and 70MW in the second half of 2025. After the contract expires, CoreWeave has two options to renew for 5 years each. Due to the company's bankruptcy restructuring at the time, the contract stipulates that CoreWeave will cover all capital expenditures, including construction costs (approximately $5-8 million/MW), electricity costs, etc. The company initially bears the cost of $1.5 million/MW (HPC), which will be advanced by CoreWeave; the company will then reimburse CoreWeave by offsetting 50% of the hosting fees until the costs are fully reimbursed.
By February 2025, the company had signed a total of 590MW HPC computing power contracts with CoreWeave (approximately corresponding to 800MW gross capacity), with a cumulative contract amount exceeding $10 billion, and the business terms are consistent with a series of contracts signed in 2024.
According to the company's guidance on computing power construction, for ease of calculation, it is assumed that 250MW will be operational starting in 2026, and all 590MW will be operational in 2027, with a discount rate of 10%. If CoreWeave does not renew the contract after the 12-year term, the present value of the computing power contract with CoreWeave is approximately $3.72 billion; if CoreWeave chooses to renew for 10 years after expiration, the present value of the computing power contract with CoreWeave is approximately $5.0 billion.

By 2027, the company's data center computing power target is 1.3GW, of which 590MW has been contracted with Core Weave, expected to be delivered in 20MW, 230MW, and 340MW respectively from 2025 to 2027. Due to the limited computing power of data centers starting operations in 2025, only $0.19 million of the company's $158 million revenue in the first half of 2025 came from HPC hosting services, accounting for approximately 12.1%.
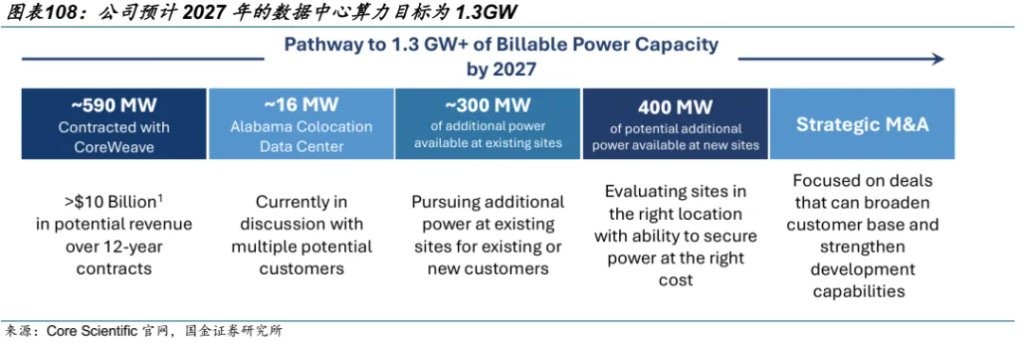
The long-term power supply agreements signed by the company with local power companies of various data centers in the past have provided a solid foundation for achieving the company's data center computing power expansion goals.
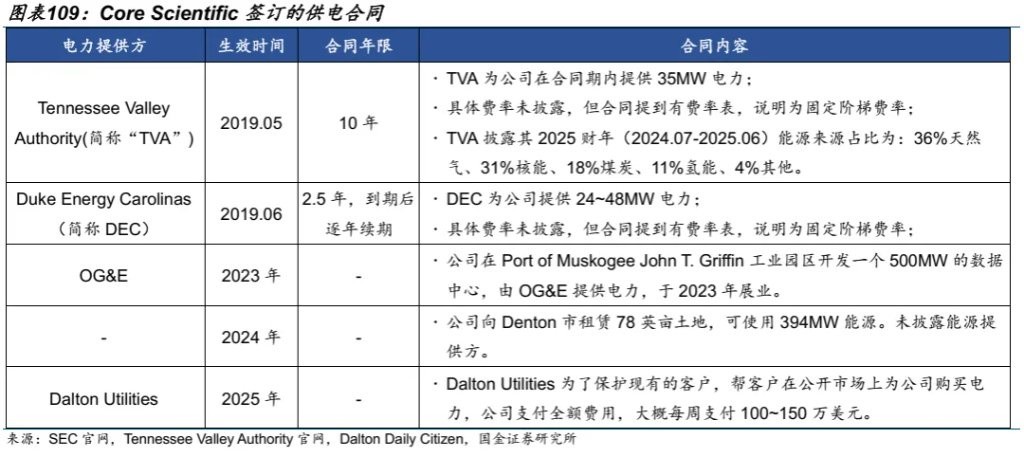
The company previously rejected CoreWeave's proposal to acquire the company at $5.75 per share in June 2024, mainly because the company believed the acquisition price severely underestimated its value. In July 2025, CoreWeave proposed again to acquire Core Scientific through a share exchange, offering 0.1235 shares of CoreWeave's Class A common stock for each share of Core Scientific's common stock. On October 30, 2025, the company's shareholders did not agree to the merger proposal. The company expects to sign at least one new AI data center hosting client in Q4 2025.
5 Guojin Research "Global Power Shortage 24 Portfolio"
Based on the above analysis, we finally obtained Guojin Research's "Global Power Shortage 24 Portfolio," as shown in the table below:
(1) Energy Storage, Core Targets: Sungrow Power Supply (300274.SZ), Canadian Solar (688472.SH), Canadian Solar (CSIQ.N); Beneficiary Targets: Trina Solar (688599.SH), East Solar (300118.SH).
(2) Power Equipment, Core Targets: Siyuan Electric (002028.SZ), Jinpan Technology (688676.SH), Igor (002922.SZ), Siemens Energy (ENR.DF), Eaton (ETN.N), General Electric (GEV.N); Beneficiary Targets: Huaming Equipment (002270.SZ), Jingquan Technology (002885.SZ), Shunfa Electric (603530.SH), Liangxin Co., Ltd. (002706.SZ), Huatong Cable (605196.SH), Hongfa Co., Ltd. (600885.SH) (3) Gas turbines, core target: Yingliu Co., Ltd. (603308.SH).
(4) SOFC, core targets: Sanhuan Group (300408.SZ), Bloom Energy (BE.N).
(5) SMR, beneficiary target: Oklo (OKLO.N).
(6) Aluminum, core targets: Tianshan Aluminum (002532.SZ), Shenhuo Co., Ltd. (000933.SZ).
(7) Pipe materials, core target: Changbao Co., Ltd. (002478.SZ).
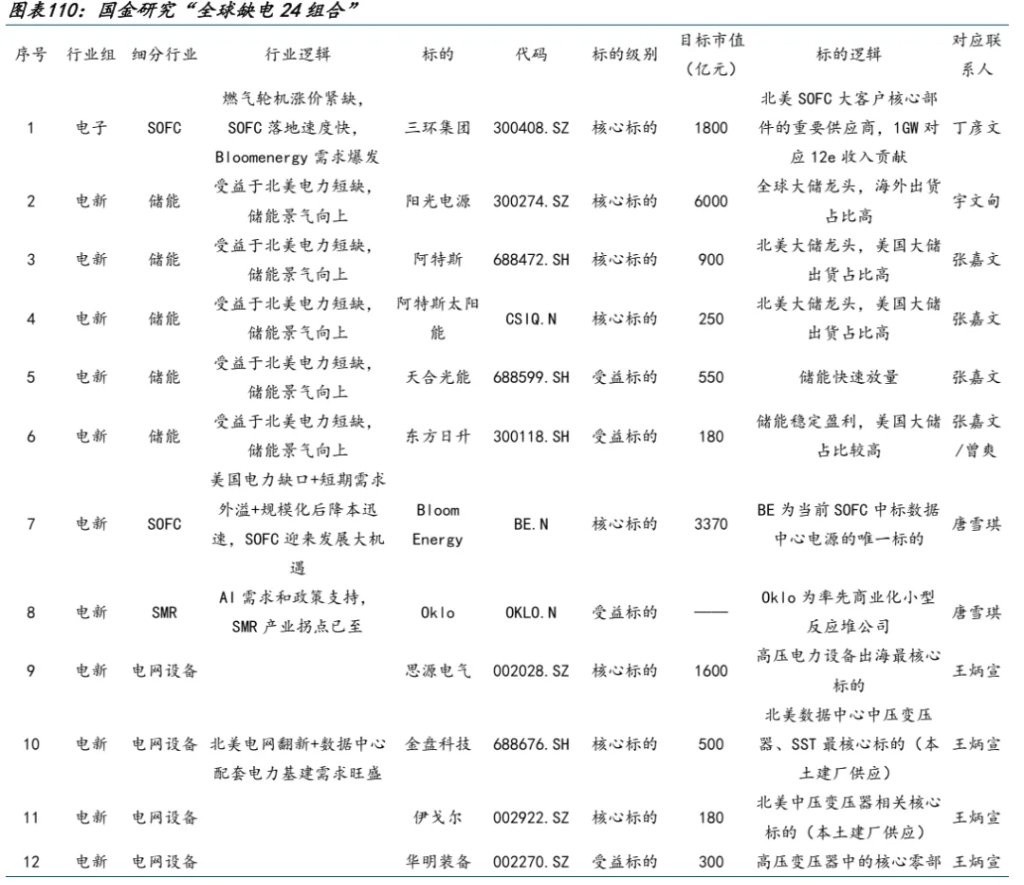
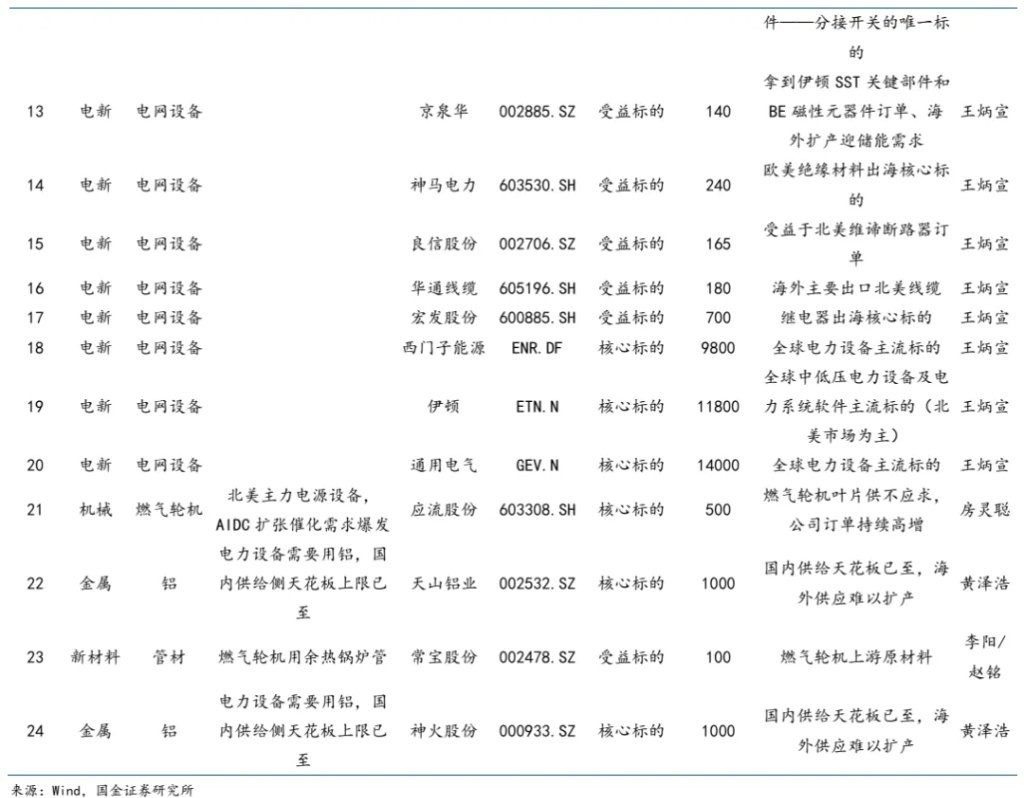
Risk warning and disclaimer
The market has risks, and investment requires caution. This article does not constitute personal investment advice and does not take into account the specific investment goals, financial conditions, or needs of individual users. Users should consider whether any opinions, views, or conclusions in this article are suitable for their specific circumstances. Investing based on this is at your own risk
