

CICC: The "Ignored" Bull Market

CICC analyzed the current bull market and pointed out that since the policy shift last year, market performance has exceeded expectations. Despite the market rise, divergences have increased, and some sectors are overvalued. The dynamic price-to-earnings ratio of the Hang Seng Index is 11.6 times, higher than the historical average, while the S&P 500 is 22.3 times. CICC believes that simply comparing the valuations of the Chinese and American markets is not very meaningful and that profitability and liquidity conditions need to be considered
How Far Can a Liquidity-Driven Market Go?
Since the shift in the "924" policy last year, the domestic market has rebounded from its lows, performing far better than even the most optimistic expectations at the beginning. After July this year, the market accelerated upward under narratives such as "capital entering the market," "deposit migration," and "de-dollarization," with the Shanghai Composite Index and Hang Seng Index rising as much as 47% and 50% from their lows, entering a "bull market" phase.
However, as the market continues to rise, divergences are also increasing.
► On one hand, the current market is indeed at a level far different from that of more than a year ago, making it hard to say it is cheap, and even some high-growth sectors have already "become expensive." Taking Hong Kong stocks as an example, the Hang Seng Index's dynamic PE is 11.6 times, close to one standard deviation above the average since 2015, and the risk premium has even dipped below the low point during the housing renovation cycle in early 2018, making it hard to claim it is "cheap."
Chart 1: Current dynamic PE of the Hang Seng Index is 11.6 times, close to one standard deviation above the average since 2015
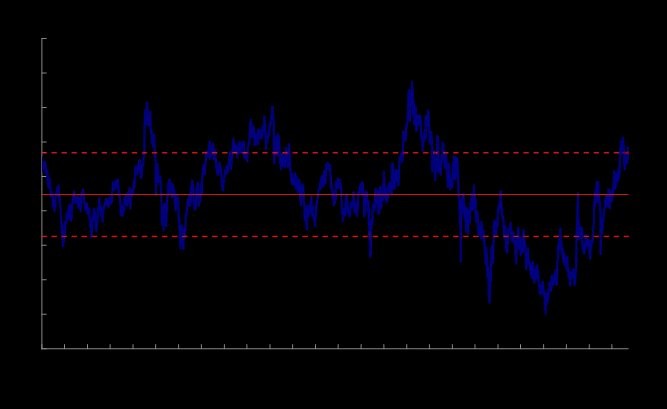
Source: Bloomberg, CICC Research Department
Chart 2: Current dynamic valuation of the S&P 500 is 22.3 times
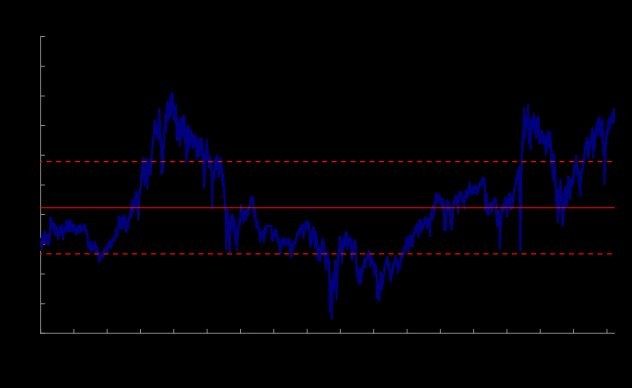
Source: Bloomberg, CICC Research Department
Some may argue that 1) it is no longer cheap compared to itself, but still lower than other markets like the U.S. stock market (for example, the dynamic valuation of the S&P 500 is 22.3 times). On the surface, this seems true, but a simple comparison that does not differentiate profitability, liquidity environment, and investor structure is not only meaningless but can also be quite misleading. For instance, taking "core assets," which are also technology leaders, as an example, the median PE of Chinese leaders is 17.8 times, which is higher than the median net profit margin of 9.6%, while the median PE of M7 at 30.2 times is more aligned with the median net profit margin of 29.8%.
Chart 3: From an absolute valuation perspective, U.S. stock valuations, especially for technology leaders, are indeed higher than those in China
Source: FactSet, CICC Research Department
Chart 4: However, when combined with profitability, the valuations on both sides are relatively reasonable, and some Chinese technology leaders may even be overvalued
 Source: FactSet, China International Capital Corporation Research Department
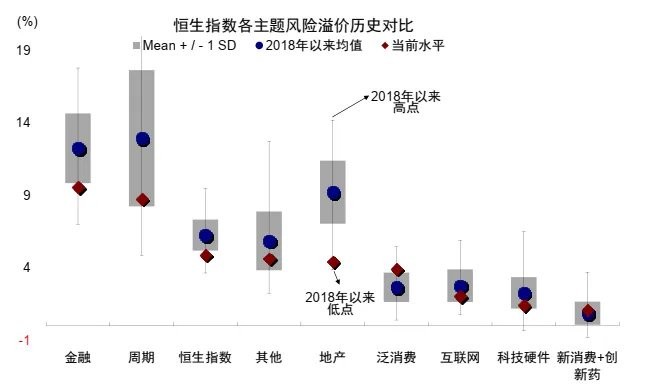
- The structural differences are significant, and the overall method is not very meaningful. This is indeed a fact; currently, the risk premiums of traditional sectors such as finance, cyclical industries, and real estate have fallen below one standard deviation of the historical average. After recent adjustments, the risk premiums of new consumption and innovative pharmaceuticals are basically around the historical average, while internet technology is also below the historical average, but there is still a certain gap compared to the levels at the peak of the Hang Seng Technology Index in early 2021 (《 2026 Hong Kong Stock Market Outlook: The Next Step of the "Bull Market"》).
Chart 5: Significant differences in risk premiums across different sectors of the Hang Seng Index
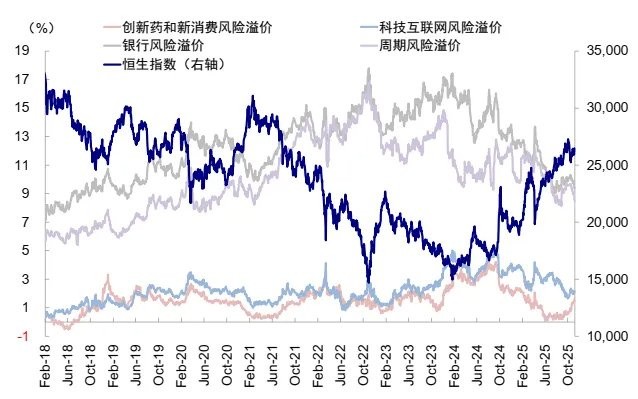
Source: Bloomberg, FactSet, China International Capital Corporation Research Department
Chart 6: Major structural risk premiums are basically at historical lows
Source: Bloomberg, FactSet, China International Capital Corporation Research Department
► On the other hand, the "financial heat" and "economic cold" continue to diverge, with various data related to domestic demand accelerating to weaken after August. Recent financial credit data for October also confirms our previous judgment that the credit cycle will reach a downward turning point in the fourth quarter.
Chart 7: The pulse of the broad fiscal deficit and the pulse of private sector social financing will oscillate and weaken after the fourth quarter
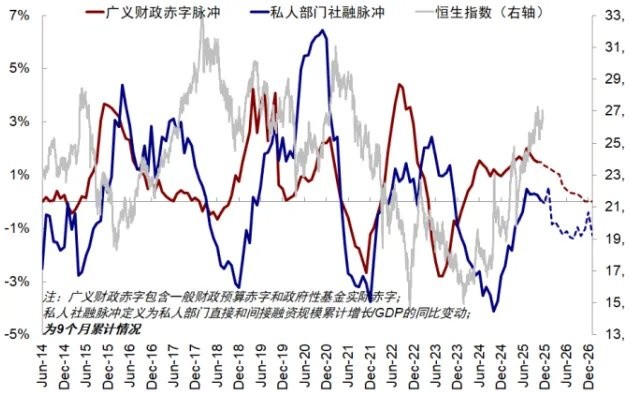
Source: Wind, China International Capital Corporation Research Department
Chart 8: The scale of the broad fiscal deficit in September declined year-on-year
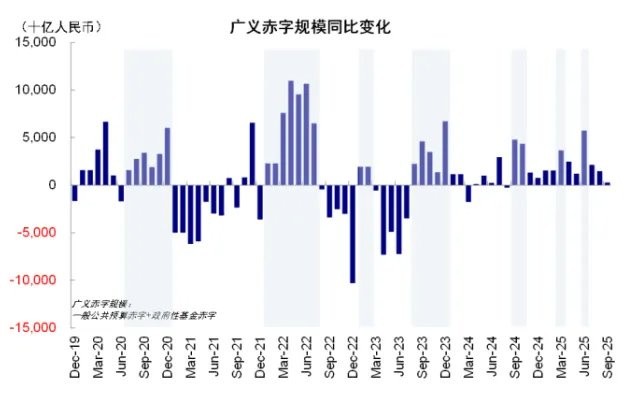
Source: Wind, China International Capital Corporation Research Department
Chart 9: "Scarce assets" are determined by the credit cycle
 Source: CICC Research Department
At present, the market is no longer concerned about whether a bull market can be brought about solely by liquidity and a lack of fundamentals; the bull market has already emerged, but how far can this bull market go?
In our article "Why Didn't Japanese Residents Enter the Market That Year?", we analyzed the behavior of Japanese residents in the low-interest-rate environment and three rounds of "bull markets" following the collapse of the real estate bubble in the 1990s. We found a pattern: relying solely on low interest rates and a "bull market" environment can promote active trading, but it is difficult to form a long-term positive feedback loop of "capital entering the market → wealth effect → capital entering the market." In other words, a "bull market" can exist driven only by liquidity, but there will always be a "ceiling."
So, where is this "ceiling"? What can break it? What lessons can be drawn from the three rounds of "bull markets" in the Japanese stock market?
The "Ignored" Bull Market: A Review of the Three Rounds of Bull Markets in the Japanese Stock Market in the 1990s
Contrary to common perception, the Japanese stock market bottomed out much earlier than expected after the real estate bubble burst in 1989, reaching its bottom by 1992. It experienced three rounds of rebounds in 1992, 1995, and 1998, each close to or exceeding 50%, lasting over a year.
However, it is referred to as the "ignored" bull market because, on one hand, the impression of "losing thirty years" is deeply ingrained, and on the other hand, each of these three "bull markets" lasted only about a year and began to correct at roughly the same high point. Therefore, from the perspective of a long-term cycle over decades, they appear insignificant and can only be considered as "box fluctuations."
Chart 10: The Japanese stock market experienced three rebounds of 50% or more lasting over a year after the bubble burst in the 1990s.
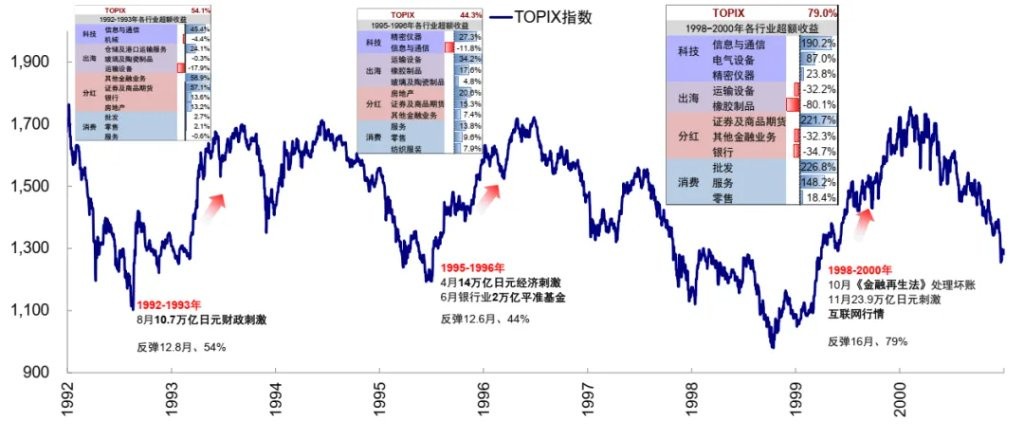
Source: Bloomberg, FactSet, CICC Research Department
Chart 11: However, from a longer time dimension, they ultimately present a "box fluctuation" pattern.
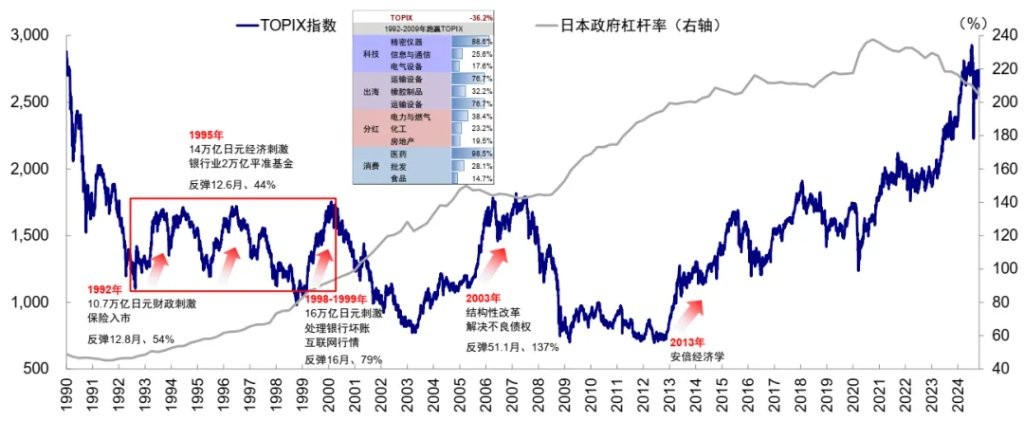
Source: Bloomberg, FactSet, CICC Research Department
Further exploring why the three rounds of "bull markets" in the 1990s Japan occurred, what drove each round, why they ended, and why they couldn't break the "ceiling," as well as the behaviors of different entities, has significant implications for the present.
First Round (1992-1993): Rebound of 54%, lasting 12.8 months; driven by fiscal shift, first finance then technology, valuation dominated.
Cause: The fiscal shift drove the birth of the first round of the bull market. After the bubble burst in the early 1990s, the Japanese stock market began to decline after peaking in 1989, with the Nikkei 225 index and the TOPIX index cumulatively dropping 63% and 62%, respectively, by the low point in 1992 Despite the Bank of Japan's rapid and significant interest rate cuts starting in July 1991, the growth rate of credit to Japanese enterprises and residents continued to decline sharply, with private demand dragging down GDP growth, and the stock market failed to reverse its downward trend. It wasn't until August 1992 that the Miyazawa Cabinet announced a fiscal stimulus of 10.7 trillion yen, accounting for 2.2% of that year's GDP, aimed at expanding public investment, which led to a rebound in the stock market.
Chart 12: Private Demand Drags Down GDP Growth Rate
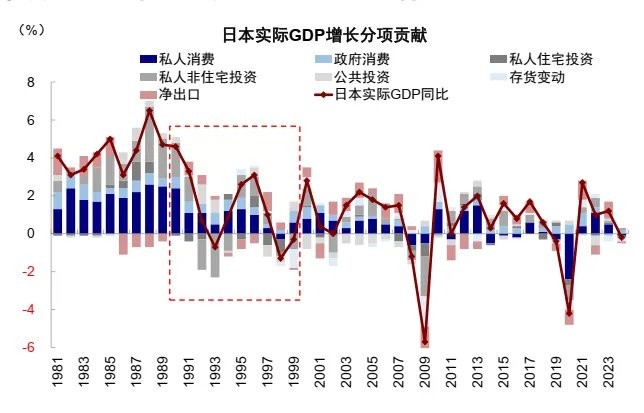
Source: Haver, CICC Research Department
Process: The Tokyo Stock Exchange Index rebounded 54% from the low in August 1992 to the high in September 1993, lasting 12.8 months. This can be divided into three phases: 1) Rapid Surge: Within less than a month after the announcement of the 10.7 trillion yen economic measures in August, the Nikkei 225 and the Tokyo Stock Exchange Index rebounded by 32% and 28%, respectively. 2) Pullback and Fluctuation: Subsequently, in September, Japan's M2 turned negative year-on-year, consumer confidence index accelerated its decline, and the stock market pulled back to November 1992 due to disappointing economic data. 3) Rebound: After about 4 months of fluctuations, the overall index saw a rebound in February 1993 when the Bank of Japan restarted interest rate cuts by 75 basis points after a 7-month hiatus, and in April, the Miyazawa Cabinet introduced a 13.2 trillion yen stimulus, leading to another rebound in Japanese stocks until September 1993.
Chart 13: The first bull market experienced a pullback one month after the rise, until the second wave of increase following the fiscal and monetary boost in 1993
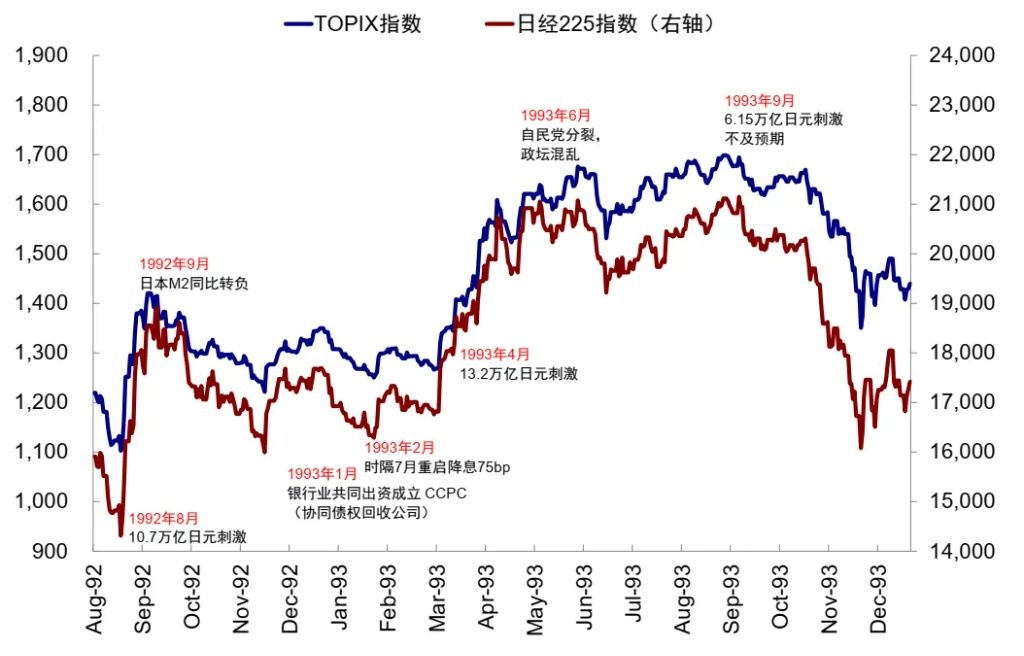
Source: Bloomberg, CICC Research Department
- Valuation expansion was the main contributor, while earnings actually declined; during this period, the static PE of Japanese stocks expanded by 106%, while the implied EPS growth rate fell by 25%.
Chart 14: In the first bull market, the PE of Japanese stocks expanded by 106%, while the implied EPS growth rate fell by 25%
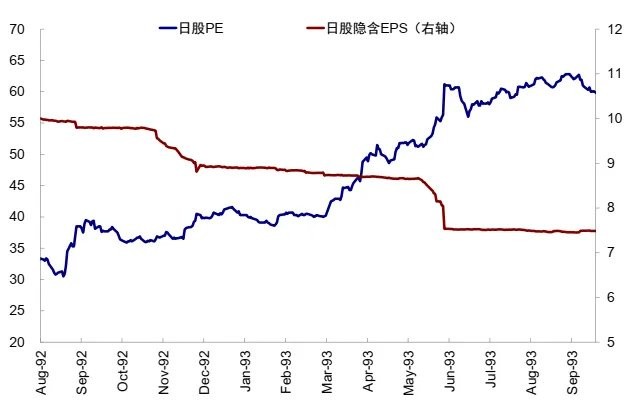
Note: The PE of Japanese stocks here refers to the static P/E of the Datastream Japan All Market Index.
Source: Datastream, CICC Research Department
- In the initial phase of the surge, financial and real estate sectors led the way, while in the second phase, information and communication sectors caught up in the mid to late stage. In the initial month, previously oversold cyclical sectors such as financials and real estate rebounded strongly, and after the market pullback, the information and communication sectors led the rise in the subsequent upward phase Chart 15: The sectors that were oversold during the bubble burst period of the first bull market, such as finance and real estate, lead the rally.
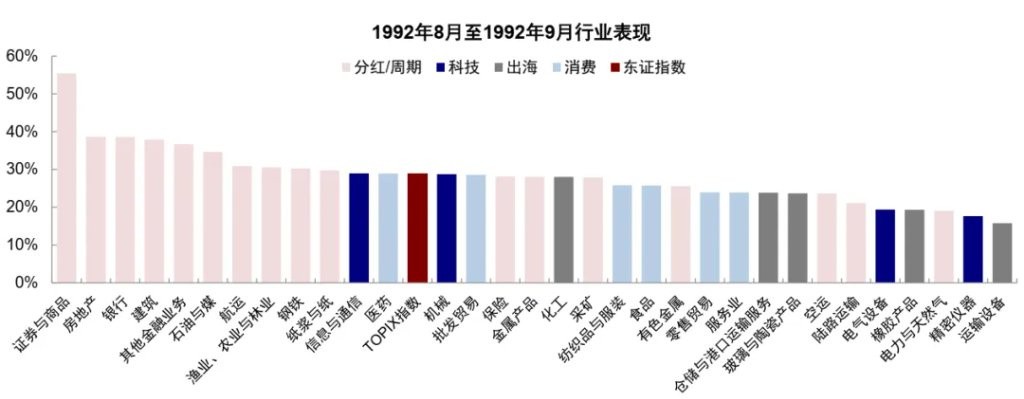
Source: Bloomberg, CICC Research Department
Chart 16: In the mid-to-late stage of the first bull market, information and communication catch up and lead the rally.
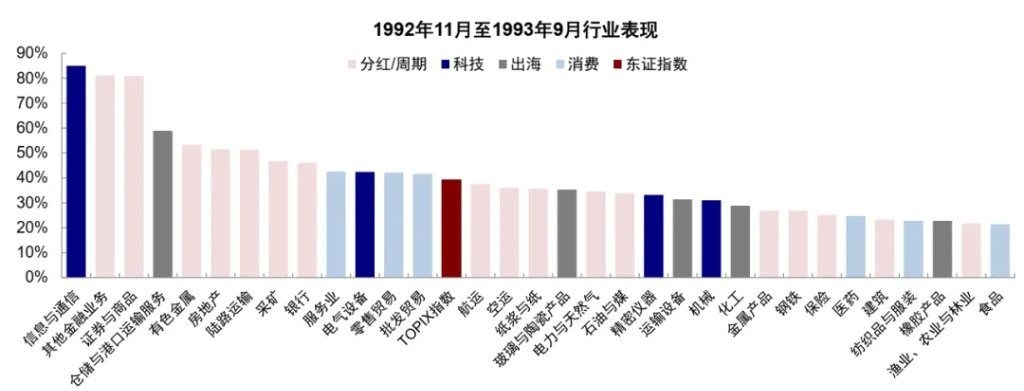
Source: Bloomberg, CICC Research Department
- From the perspective of investor structure, the proportion of individual investors once increased, while the proportion of overseas investors declined, and institutional investors rose. In the early stage of this bull market, Japanese individual investors were quite enthusiastic, with the proportion of individual investors in transaction volume rapidly rising from 18.7% in September 1992 to 26.7% in November. However, during the market turbulence, it fell back to a low of 15.5% in April 1993, and then rebounded again to 25.5% before the end of the bull market in July 1993. In contrast, the transaction proportion of overseas investors initially rose from 18.8% in August 1992 to 24.1% in September, but then continuously declined to 13.8% before the end of the bull market in July 1993. The transaction proportion of institutional investors, excluding brokerages, rose from 25.0% to 33.7%.
Chart 17: The proportion of individual investors in the first bull market once increased, while the proportion of overseas investors declined, and institutional investors rose.
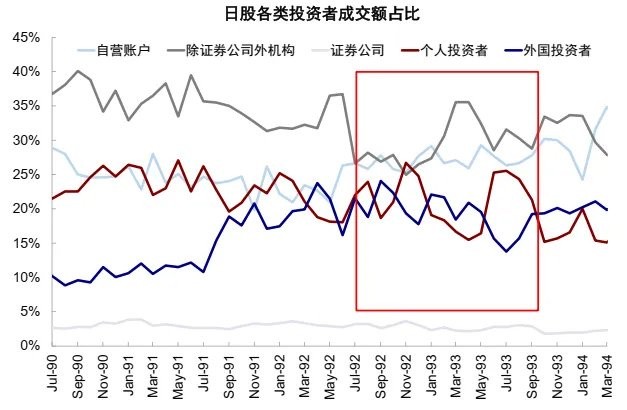
Source: CEIC, CICC Research Department
Conclusion: The fundamentals remain weak, and policies fall short of expectations. In September 1993, the Japanese government introduced another stimulus of 6.15 trillion yen, and the Bank of Japan cut interest rates by 75 basis points again, but the fiscal scale was less than before, failing to sustain the stock market's upward momentum. Coupled with the gradual emergence of bank bad debt issues, Japanese stocks turned downward from September 1993, and in the following three months, the Nikkei 225 and the TOPIX indices corrected by 23% and 20%, respectively. During this period, sectors such as information and communication and finance and real estate, which had risen significantly in the previous bull market, led the decline, while retail trade, electricity, and natural gas sectors experienced smaller declines.
Second Round (1995-1996): A 50% rebound lasting 12.6 months; stock market stabilization fund + post-disaster reconstruction investment trend, driven by both valuation and earnings.
Cause: The second bull market began in response to policy stimulus to cope with the impact of the Hanshin earthquake and yen appreciation. In early 1995, the Japanese economy was overshadowed by the Hanshin earthquake and the impact of yen appreciation. On one hand, the Hanshin earthquake that broke out in January 1995 caused significant economic losses to Japan, but it also created a demand for post-disaster reconstruction On the other hand, the safe-haven demand brought about by the Mexican peso crisis at the end of 1994, the "weak dollar" policy of the Clinton administration in its early days, and the demand for capital repatriation after the earthquake in early 1995 collectively drove the Japanese yen to appreciate by 20.5% in less than four months in early 1995. In response to this situation, in April 1995, the Japanese government launched an emergency economic measure of 4.8 trillion yen, and the Bank of Japan further lowered the benchmark interest rate by 75 basis points to 1.0%, which propelled the Nikkei 225 and the TOPIX to rise by 11% and 8% respectively within one month.
Process: In June 1995, the Japanese government established a "stock market stabilization fund" of about 2 trillion yen, leading to the second round of a bull market in Japanese stocks, which lasted for 12.6 months, during which the Nikkei 225 and the TOPIX rose by 56% and 44% respectively. In the early stages of this bull market, both internal and external environments were favorable for economic recovery and stock market growth. Internally, following the entry of the stock market stabilization fund in June, the Japanese government further injected 14.2 trillion yen in fiscal stimulus in September, and the Bank of Japan cut interest rates by another 50 basis points. Meanwhile, the USD/JPY exchange rate quickly rose from a low of 81 in April 1995 to a high of 105 in September, and the depreciation of the yen stimulated Japanese exports and the rebound of Japanese stocks. Externally, in July 1995, the Federal Reserve began "preemptive" interest rate cuts, creating a loose external environment. Under these circumstances, there were signs of economic recovery in Japan, with the actual GDP year-on-year growth rate rebounding from 1.3% in the first quarter of 1995 to 2.9% in the second quarter, and maintaining above 3% until the third quarter of 1996. The consumer confidence index also rose from 42.1 in September 1995 to 46.9 in June 1996. Japanese stocks continued to rebound until early 1996, during which:
Chart 18: The favorable internal and external environment in the early stages of the second bull market contributed to the rise of Japanese stocks, which turned into fluctuations after 1996, ending the bull market in June.
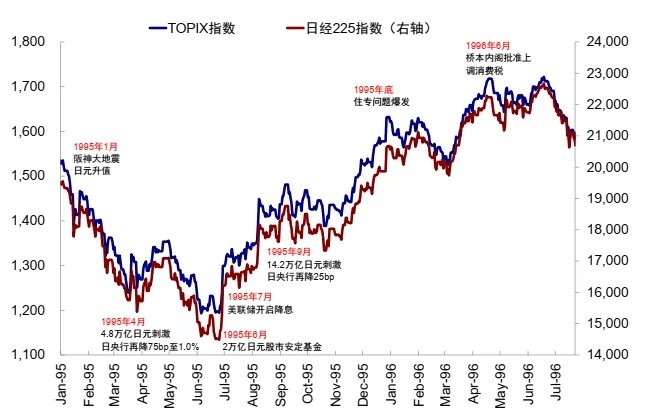
Source: Bloomberg, CICC Research Department
- Still mainly driven by valuation, but profits also grew, with Japanese stock valuations expanding by 24% and profits increasing by 16% during this period.
Chart 19: The second bull market was still mainly driven by valuation (expansion of 24%), but profits (growth of 16%) also saw an increase.
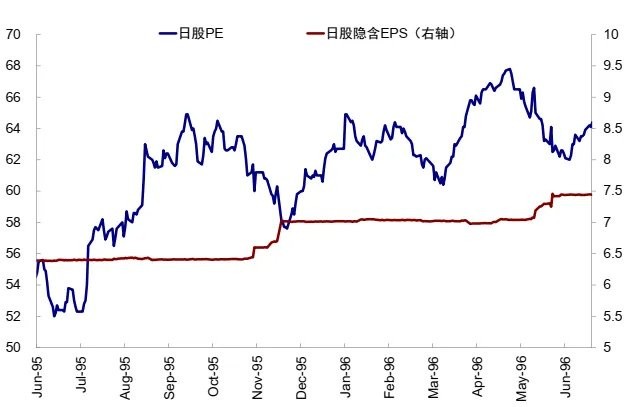
Note: Here, the Japanese stock PE refers to the static P/E of the Datastream Japan All Market Index, with implied EPS calculated based on the price of the Datastream Japan All Market Index Data source: Datastream, China International Capital Corporation Research Department
- In terms of industry performance, all sectors experienced a broad rise, with transportation equipment, precision instruments, and machinery sectors seeing even greater increases.
Chart 20: In the second round of the bull market, all industries rose, with transportation equipment, precision instruments, and machinery sectors seeing even greater increases.
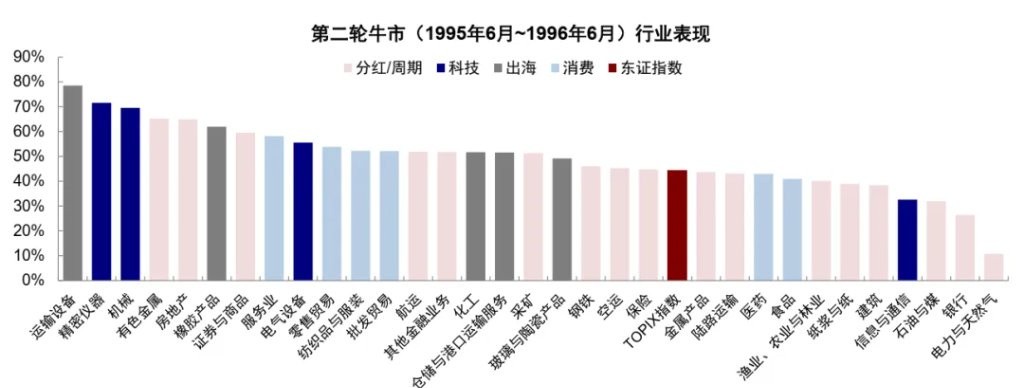
Data source: Bloomberg, China International Capital Corporation Research Department
- From the perspective of investor structure, the enthusiasm of individual investors to enter the market also could not be sustained, while the trading proportion of foreign investors increased. The proportion of individual investors in trading volume rose from 12.5% in August 1995 to a peak of 22.3% in November, but then declined to 14.9% by the end of the bull market. The trading proportion of foreign investors increased from 24.6% before the bull market started to a peak of 27.0% in July 1996 after the bull market ended.
Chart 21: The enthusiasm of individual investors to enter the market in the second round of the bull market could not be sustained, while the trading proportion of foreign investors increased.
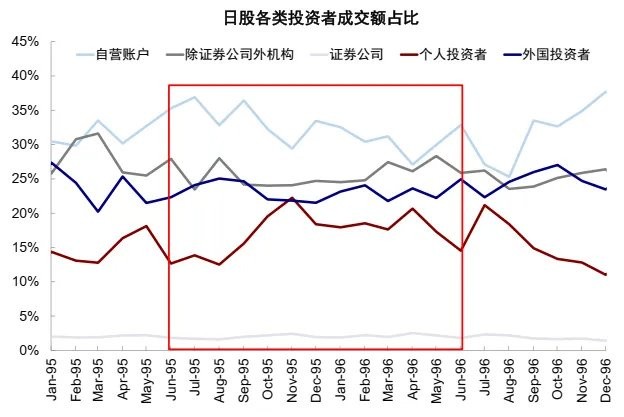
Data source: CEIC, China International Capital Corporation Research Department
End: Expectations of fiscal tightening and the outbreak of non-performing asset issues exacerbated the decline in the stock market during the Asian financial crisis and banking crisis. At the end of 1995, Japan's "Jusen" non-performing asset issue broke out, and after debates in the Japanese parliament, it was decided to inject 680 billion yen into "Jusen" companies in 1996 to cover losses, causing dissatisfaction among the Japanese public, leading the stock market to turn down and fluctuate after 1996. In June 1996, the Hashimoto Cabinet approved an increase in the consumption tax starting in April 1997, which caused Japanese stocks to completely turn down from the end of June, and in the following seven months, the Nikkei 225 and Tokyo Stock Exchange indices fell by 24% and 23%, respectively, with the financial and transportation sectors leading the decline, while the pharmaceutical, precision instruments, and transportation equipment sectors experienced relatively smaller declines. Subsequently, in 1997, the Japanese economy fell back into recession due to the increase in consumption tax, the Asian financial crisis, and the Japanese banking crisis, with Japanese stocks accelerating their decline after July 1997.
Third Round (1998-2000): A 60% rebound, lasting 16 months; a structural market under the information technology revolution, dominated by valuations, with an increase in the proportion of individual investors
Cause: The initiation of the third round of the bull market was jointly driven by internal policy stimulation and external information technology revolution. After 1998, Japan's fiscal focus shifted from infrastructure to structural issues and people's livelihoods, with the proportion of public works in fiscal expenditure gradually decreasing from 17% in 1998 to 7% in 2010, while the proportion of social security increased from 18% in 1998 to 30% in 2010 In March 1998, Japan injected 18 trillion yen into 21 major banks for the first time, but failed to stabilize the financial system. The Long-Term Credit Bank of Japan and the Nippon Credit Bank went bankrupt one after another and were nationalized, leading to continued turmoil in the financial markets. The turning point came after October 1998: 1) In October, the Financial Revival Act was introduced, utilizing 60 trillion yen of public funds, of which 25 trillion yen was directly used for bank injections, and the rest for dealing with bankrupt financial institutions, etc.; 2) In November, the Obuchi Cabinet further launched a fiscal stimulus of 23.9 trillion yen, explicitly setting employment as a separate goal with a dedicated budget; 3) Coupled with the transmission of the U.S. internet market, these factors jointly propelled the Japanese stock market into its third bull market after October 1998, lasting 16 months until the bursting of the tech bubble in March 2000, during which the Nikkei 225 and the TOPIX rose by 62% and 79% respectively.
Chart 22: From the structure of fiscal expenditure, Japan's fiscal focus shifted from infrastructure to people's livelihood after 1998
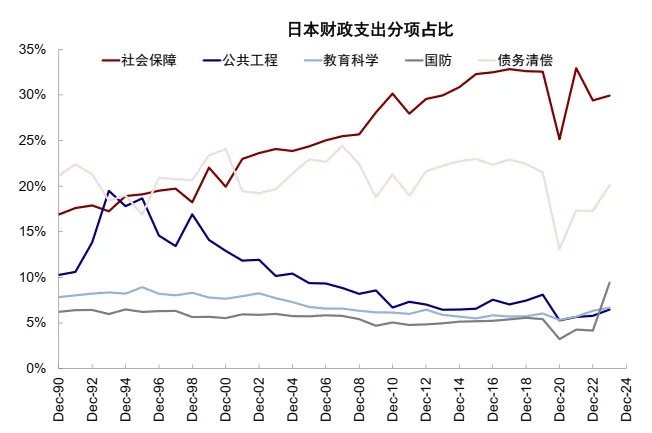
Source: Haver, CICC Research Department
Process: With internal policies gradually "targeting the symptoms" and strong external industrial trends supporting it, the third bull market lasted longer and had a larger increase compared to the previous two bull markets. Initially, after the market rebound in October 1998, it turned to decline by the end of 1998, but soon in February 1999, the Bank of Japan's zero interest rate policy and the implementation of 7.5 trillion yen injections into the banking sector in March continued to drive the market upward. The Obuchi government's fiscal and monetary policies remained accommodative, and with the support of global economic recovery and industrial trends, Japan's real GDP growth rate briefly turned positive year-on-year in mid-1999, and the consumer confidence index rose from a low of 34.8 in the third quarter of 1998 to 42.1 in the first quarter of 2000. However, the foundation of the economic recovery was not solid, and the issue of low prices remained prominent, with the CPI being negative year-on-year for a long time after 1998.
Chart 23: The third bull market lasted longer and had a larger increase under the gradual "targeting the symptoms" of internal policies and strong external industrial trends
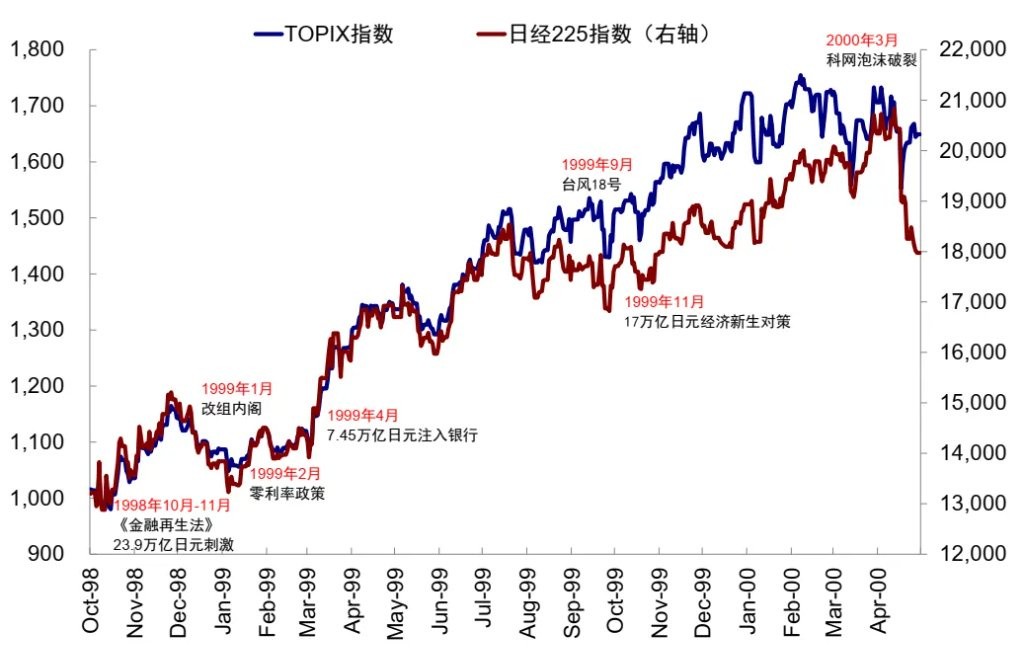
Source: Bloomberg, CICC Research Department
1) This bull market was driven by valuation, during which the PE expanded by 128%, while earnings fell by 17%.
Chart 24: The third bull market was mainly driven by valuation, during which the PE expanded by 128%, and EPS fell by 17%
 Note: The PE ratio for Japanese stocks here refers to the static P/E of the Datastream Japan All Market Index, with the implied EPS calculated based on the price of the Datastream Japan All Market Index.
Source: Datastream, China International Capital Corporation Research Department
2) This round of bull market driven by technological revolution is a typical structural market, with only 7 out of 33 Tokyo Stock Exchange sub-industries outperforming the index. The leading sectors are mainly the information and communication technology sectors reflected by U.S. tech stocks, as well as industries like securities benefiting from the alleviation of financial risks.
Chart 25: The third round of the bull market is a typical structural market, with wholesale trade, securities, and information communication sectors leading the way.
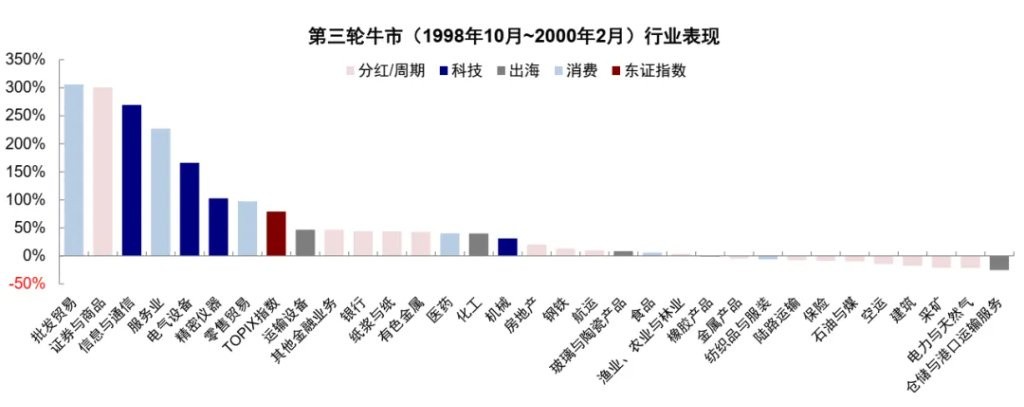
Source: Bloomberg, China International Capital Corporation Research Department
3) The proportion of individual investors in trading volume continues to rise, while the proportion of institutional investors declines, and the trading volume of foreign investors remains relatively stable. The trading volume proportion of individual investors rose from 8.7% before the market rally to 26.1% before the end of the bull market in February 2000, especially showing a significant and rapid increase after June 1999, reflecting a more exuberant market sentiment. In contrast, the proportion of institutional trading (excluding securities) fell from 25% in October 1998 to 18% in February 2000, while the proportion of foreign investors in trading volume remained stable around 30%.
Chart 26: In the third round of the bull market, the proportion of individual investors in trading volume continues to rise, the proportion of institutions declines, and the trading volume of overseas investors remains relatively stable.
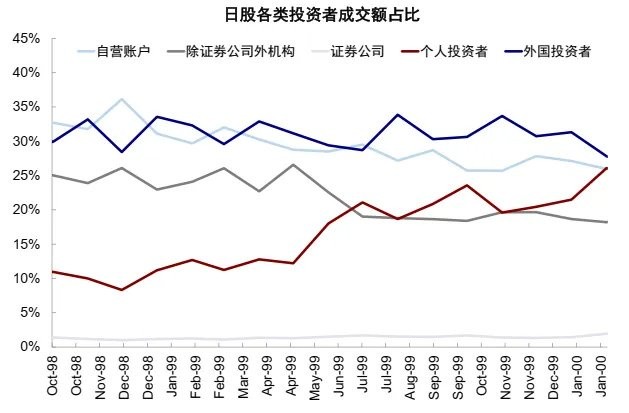
Source: CEIC, China International Capital Corporation Research Department
Conclusion: The bursting of the tech bubble ultimately ended the third round of the bull market. In March 2000, the bursting of the Nasdaq bubble triggered a global stock market correction, with the Nikkei 225 sharply declining after reaching a high of 20,833 in April 2000, falling to 13,786 by the end of 2000, a drop of 34%. Subsequently, in April 2001, Junichiro Koizumi came to power, advocating for structural reforms rather than continued large-scale fiscal stimulus. Japan's unemployment rate rose from 4.7% in early 2000 to 5.4% by the end of 2001. Additionally, the risk aversion sentiment brought about by the "911" incident in September 2001 further undermined market confidence, leading to a continued bear market in Japanese stocks until 2003, which created new lows after the bubble burst.
The "Beginning" and "End" of the Bull Market: "Beginning" with large-scale stimulus and external industrial trends; "End" with weak fundamentals, declining policy strength, exposure to internal and external risks, and exuberant sentiment.
Looking at the three rounds of "bull markets" in the Japanese stock market during the 1990s, the initiation of bull markets in the era of sluggish growth and low interest rates is closely tied to the "necessary condition" of large-scale internal fiscal stimulus. If policies are more "targeted" and align with external industrial trends, they can be sustained for a longer period. Specifically,
► Large-scale internal fiscal stimulus: Each of the three bull markets was initiated by significant fiscal efforts, with the distinction that policies became increasingly "targeted." The first bull market was directly driven by the first large-scale fiscal stimulus of 10.7 trillion yen after the bubble burst in August 1992. The second bull market was initiated by a 2 trillion yen "stock market stabilization fund" in June 1995, followed by an additional 14.2 trillion yen stimulus in September. The third bull market was driven by the "Financial Revitalization Law" in October 1998, which addressed the issue of non-performing loans in the banking sector. More importantly, policies gradually shifted towards livelihood and structural issues, rather than focusing solely on infrastructure and the stock market itself as in the first two rounds.
► Transmission of external industrial trends: The initiation of the third bull market was not only stimulated by the internal "Financial Revitalization Law" addressing structural issues but was also significantly influenced by the internet boom in the United States, thus clearly reflecting an extreme structural bull market. External industrial trends provided stronger support, leading to a longer duration and greater increase.
Correspondingly, the end of the bull market generally occurs when the fundamentals have not improved sufficiently to "take over," and factors such as declining policy strength, exposure of internal and external risks, and exuberant market sentiment come into play.
► Declining policy strength amid unaddressed fundamentals: The lack of thorough improvement in fundamentals was the overarching backdrop in 1990s Japan, making the market sensitive to whether policy strength could be sustained. Although Japan's economy experienced intermittent recovery in the 1990s, it never escaped the quagmire of deflation. Fiscal efforts were inconsistent and initially focused on infrastructure, while the banking sector's non-performing loan issues were only addressed after the crisis erupted in 1997 and were not tackled until 1998. With balance sheet recessions, the willingness of households and businesses to borrow remained low, and the private sector continued deleveraging, preventing any real improvement in economic fundamentals. In this context, the "bull market" driven by policy stimulus was sensitive to whether policy strength could be sustained; for example, when the first bull market ended in September 1993, the fiscal stimulus of 6.15 trillion yen was less than before, and when the second bull market ended in June 1996, the Hashimoto Cabinet's approval to raise the consumption tax pushed the bull market to its conclusion.
► Exposure of internal and external risk events: Internal risk events, such as the banking sector's non-performing loan issues, directly undermined the upward momentum of the second bull market when the "Housing Loan" non-performing asset problem erupted at the end of 1995; external risk events, such as the bursting of the tech bubble and the Asian financial crisis, led to the end of the third bull market and exacerbated the decline in the stock market following the end of the second bull market.
► Excessive market sentiment: This intensified volatility and prompted the end of the bull market, especially during the third bull market when sentiment was excessively exuberant. 1) From a valuation perspective, at the end of the three bull markets, the static PE ratios of the Japanese stock market were 62.8/64.0/85.2, positioned at the 98%/82%/100% percentiles since 1985 (Chart 27) 2) From the perspective of the long-short options ratio, the Nikkei 225 Index's 14-day moving average long-short options ratio was close to 2.0 at the end of the third bull market, the highest level since the 1990s. 3) In terms of the trading volume share of individual investors, at the end of the third bull market, the trading volume share of individual investors in Japan reached 26.2%, the highest level since 1993.
Chart 27: Valuations at the end of the three bull markets were at the 98%/82%/100% percentiles since 1985
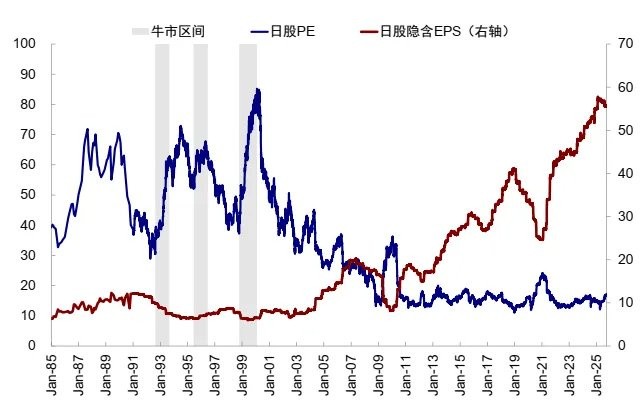
Note: Data before 1991 is from the Tokyo Stock Exchange's first trading session monthly average PE
Source: CEIC, Datastream, China International Capital Corporation Research Department
Lessons for the Present: Policy Erosion and Exposure to Internal and External Risks are the Main Reasons; The Key to Breaking the "Ceiling" Lies in Structural Policy Shifts
The current bull market since the domestic "924" fiscal shift, driven by valuations but also with strong industrial trends, has reference value from Japan's first and third bull markets. Drawing on Japan's lessons, in a situation where the economic fundamentals have not improved and it is difficult to "pass the baton," a market driven mainly by valuations and liquidity needs to pay attention to: 1) Erosion of policy strength, 2) External disturbances such as the AI bubble, 3) Exposure to internal debt risks. After all, the current PE TTM of the Shanghai Composite Index and CSI 300 has reached 16.6 times and 14.2 times, respectively, at the 94% and 84% percentiles since 2015.
Chart 28: The performance of Hong Kong stocks and A-shares year-to-date is mainly contributed by valuations
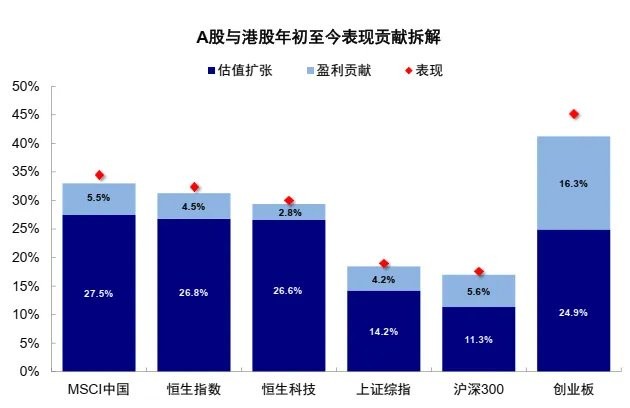
Note: Data as of November 16, 2025;
Source: Bloomberg, China International Capital Corporation Research Department
Chart 29: The current PE TTM of the Shanghai Composite Index and CSI 300 is at the 94% and 84% percentiles since 2015
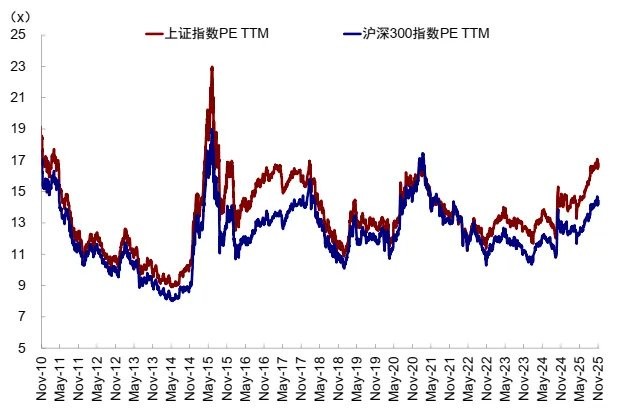
Source: Wind, China International Capital Corporation Research Department
From a longer time perspective, the reason why Japanese stocks were able to experience three "bull markets" ten years after the 1989 bubble burst, but each time failed to break the "ceiling" and fell into a box range oscillation, fundamentally lies in: relying on policy stimulus and industrial trends can indeed drive phase increases, but when these driving forces gradually deplete and market sentiment and valuations also reach high levels, structural issues remain unresolved, making it difficult for the fundamentals to "pass the baton," and the drag begins to reappear. If some internal and external risk events are also exposed, it will further increase market pressure The key to breaking this "vicious cycle" and ushering in a bull market that has lasted for over 10 years to date was the implementation of Abenomics' truly "targeted" policies at the end of 2012, which gradually helped the economy escape the deflationary cycle. At that time, after twenty years of adjustment, the debt pressure on the banking system was gradually cleared. More importantly, the structural shift in monetary policy boosted inflation expectations, and fiscal policy shifted from infrastructure projects with continuously declining returns and the stock market, which could only serve as a confidence booster, to a focus on boosting income expectations. This led to a positive year-on-year growth rate in credit for households and businesses, allowing the economy to gradually emerge from deflation and enter a positive cycle. Meanwhile, the corporate governance measures during the Abe era improved corporate ROE, resulting in a rapid expansion of EPS for Japanese stocks after 2014, with earnings replacing valuations as the main support for the rise of Japanese stocks.
Chart 30: Year-on-year growth rate of credit for Japanese households and businesses turned positive after 2013
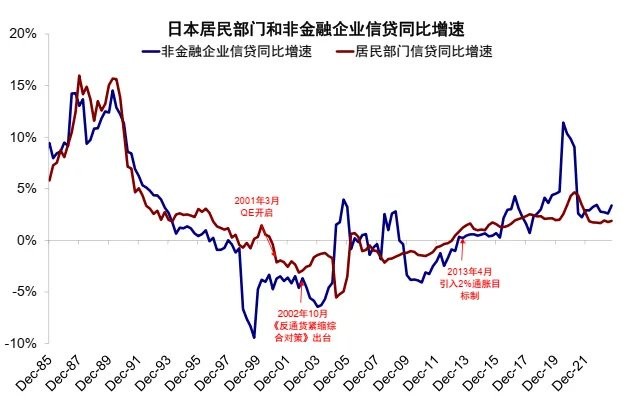
Source: Wind, CICC Research Department
Chart 31: Rapid expansion of EPS for Japanese stocks after 2014 became the main driving force for the rise of Japanese stocks
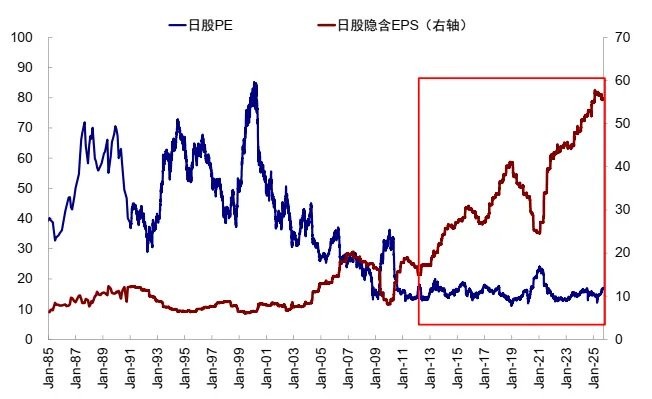
Source: Datastream, CICC Research Department
Therefore, as we analyzed in "2026 Hong Kong Stock Market Outlook: The Next Step of the 'Bull Market'", from the effectiveness of policy direction, technology + income expectations (subsidies, employment, and social security) need to be pursued together > debt reduction and real estate should be addressed sooner rather than later > infrastructure and stock market wealth effects are only temporary solutions. Drawing on Japan's experience, while striving to cultivate new growth points, especially in the technology sector, boosting income expectations (subsidies, employment, and social security) to address incremental issues, and increasing debt reduction efforts to alleviate existing debt pressure will be key to addressing the current structural challenges. In contrast, while the wealth effect of the capital market and the continuously declining returns from infrastructure may have short-term effects, their effectiveness and sustainability will face a "ceiling." Therefore, aside from technology, if more emphasis and effort are placed on income expectations and social security, debt reduction, and asset accumulation, it will make us more optimistic about future recovery prospects and allow "deposit migration" and "positive wealth effect cycles" to go further.
Chart 32: In terms of policy effectiveness ranking, technology + income expectations (subsidies, employment, and social security) need to be pursued together > debt reduction and real estate should be addressed sooner rather than later > infrastructure and stock market wealth effects are only temporary solutions
 Source: China International Capital Corporation Research Department
This article is sourced from: CICC Insights
Risk Warning and Disclaimer
The market has risks, and investment requires caution. This article does not constitute personal investment advice and does not take into account the specific investment objectives, financial conditions, or needs of individual users. Users should consider whether any opinions, views, or conclusions in this article are suitable for their specific circumstances. Investment based on this is at one's own risk
