Valuation analysis

- P/E
- Price
- High
- Median
- Low
- P/B
- Price
- High
- Median
- Low
- P/S
- Price
- High
- Median
- Low
- Dividend Yield
- Price
- High
- Median
- Low
Institutional View & Shareholder
Analyst Ratings
- Price--
- Highest--
- Lowest--
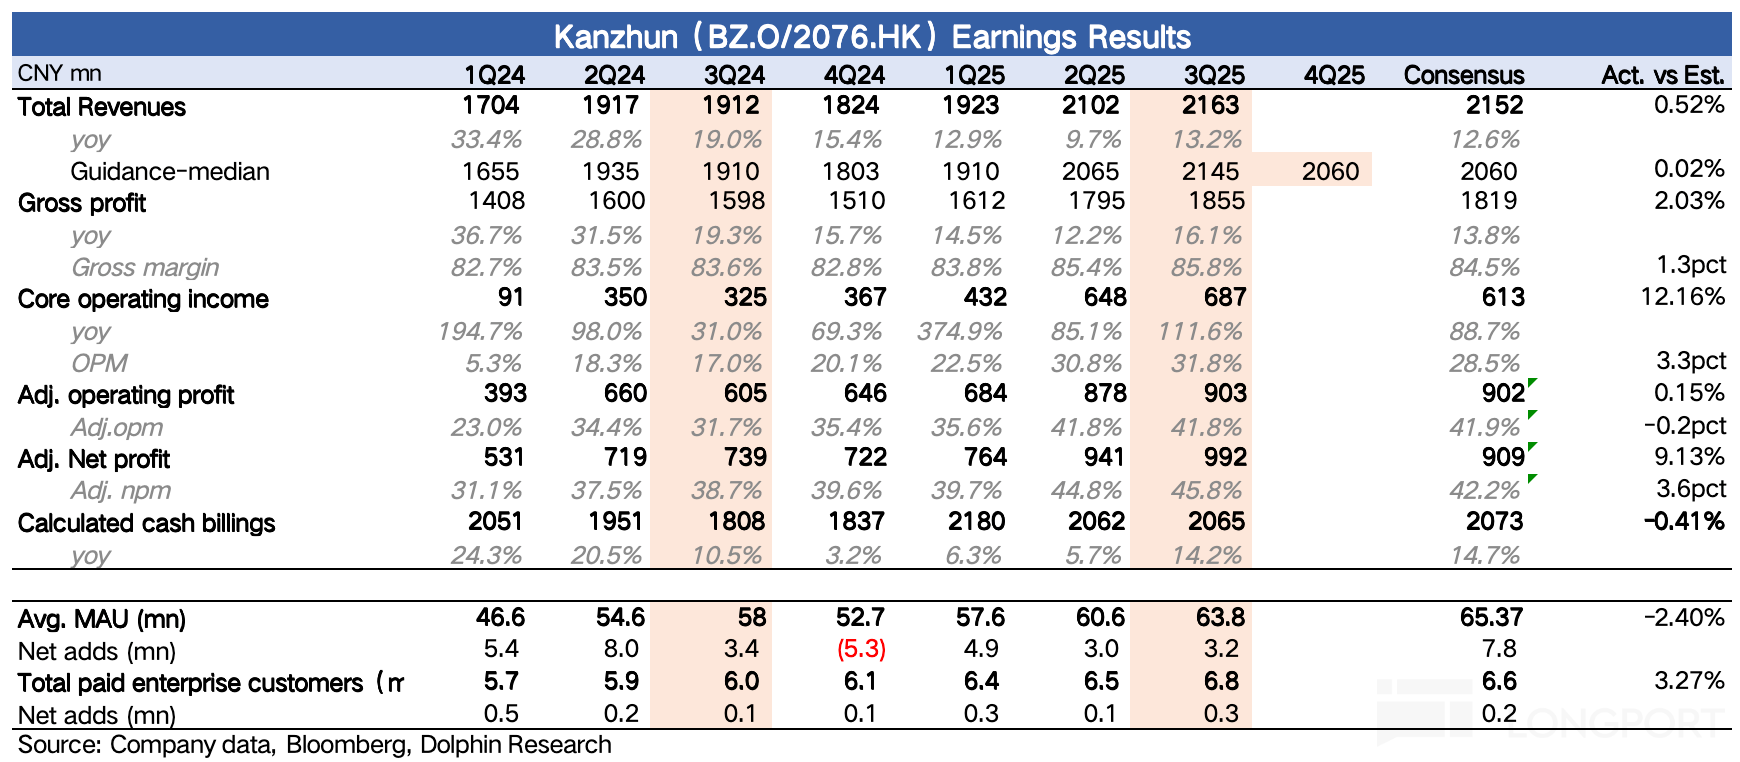
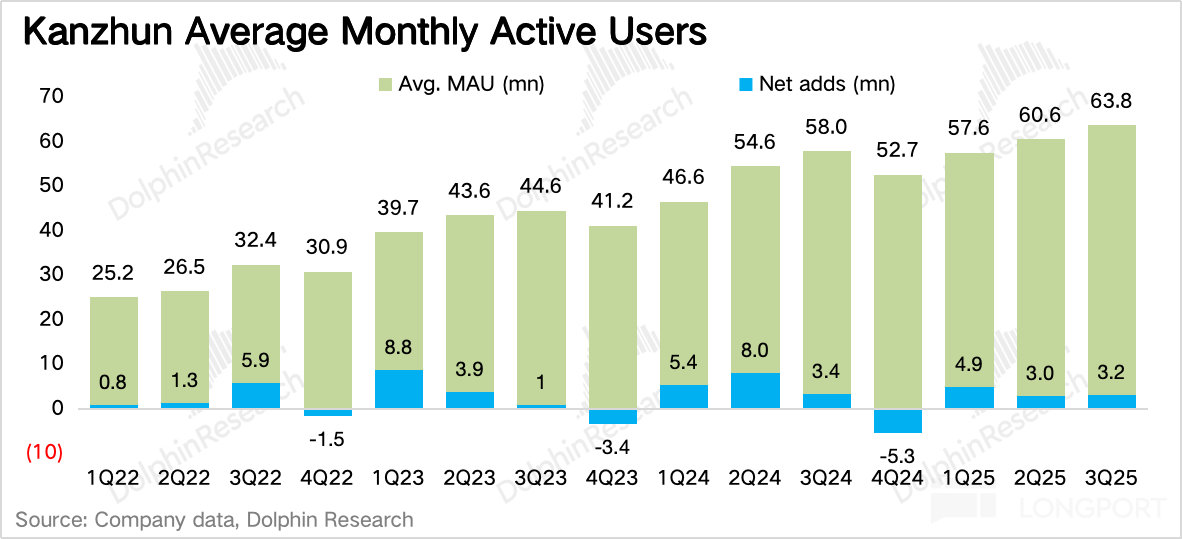
$BOSS ZHIPIN-W(02076.HK) $Kanzhun(BZ.US) Q3 financial report has been released, and the overall performance basically met expectations. It is still the same BOSS—despite still facing pressure, the com...

 +6
+6
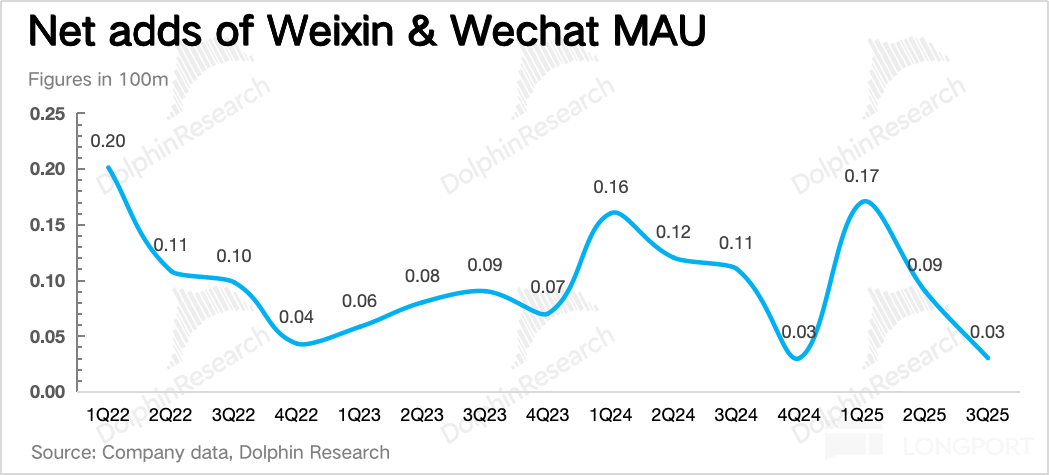
After the Hong Kong stock market closed on November 13, Beijing time, $TENCENT(00700.HK) released its third-quarter 2025 results. Overall, while there were not many surprises compared to expectations,...


 +6
+6
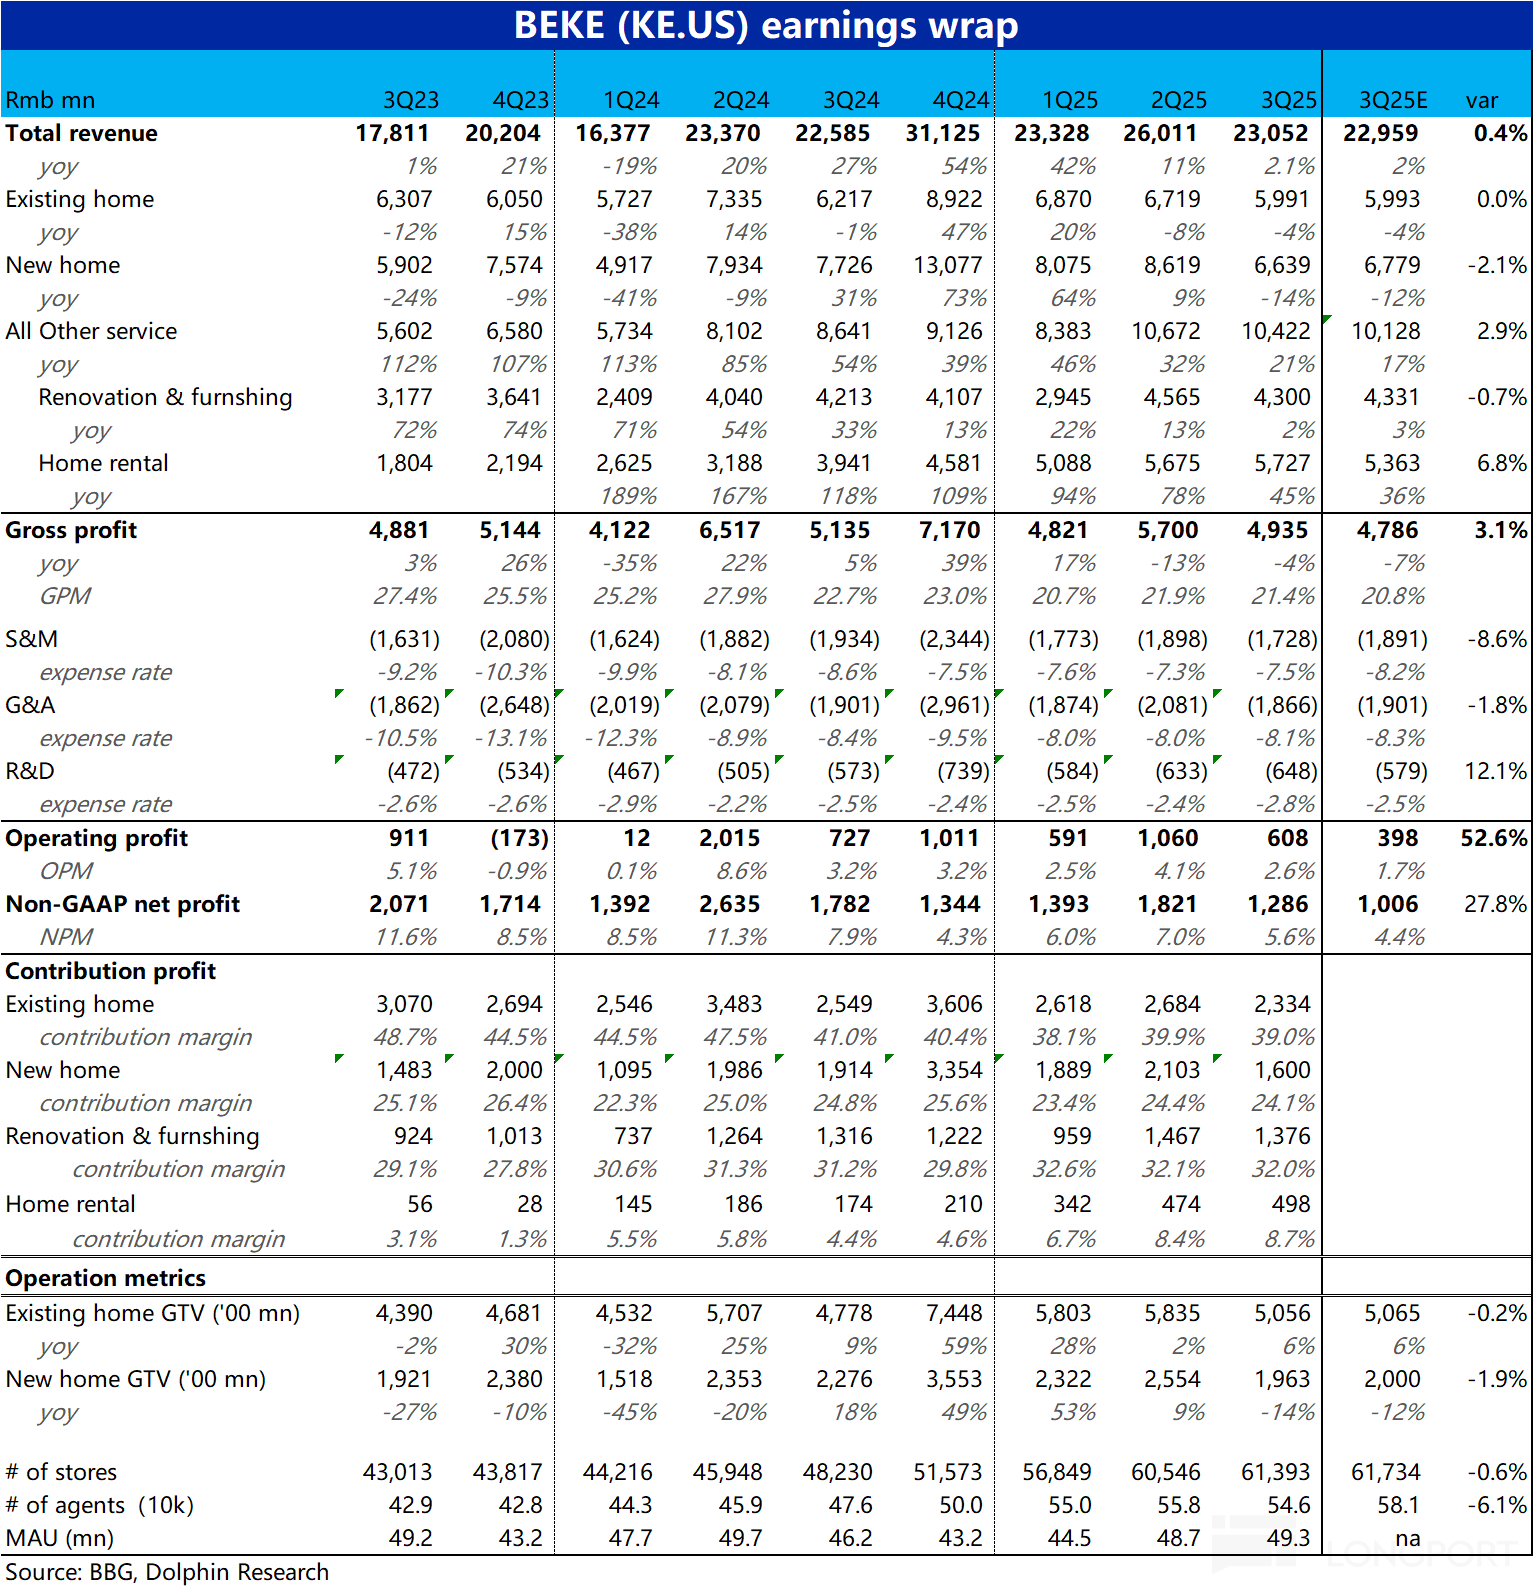
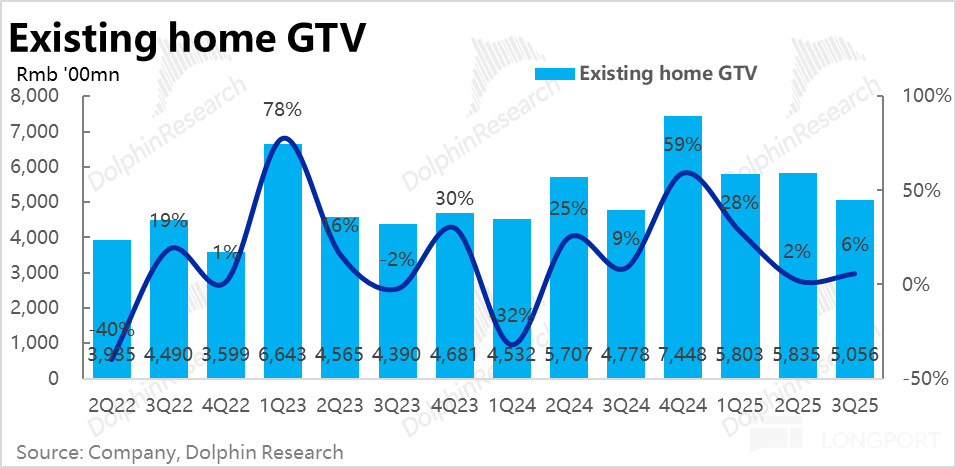
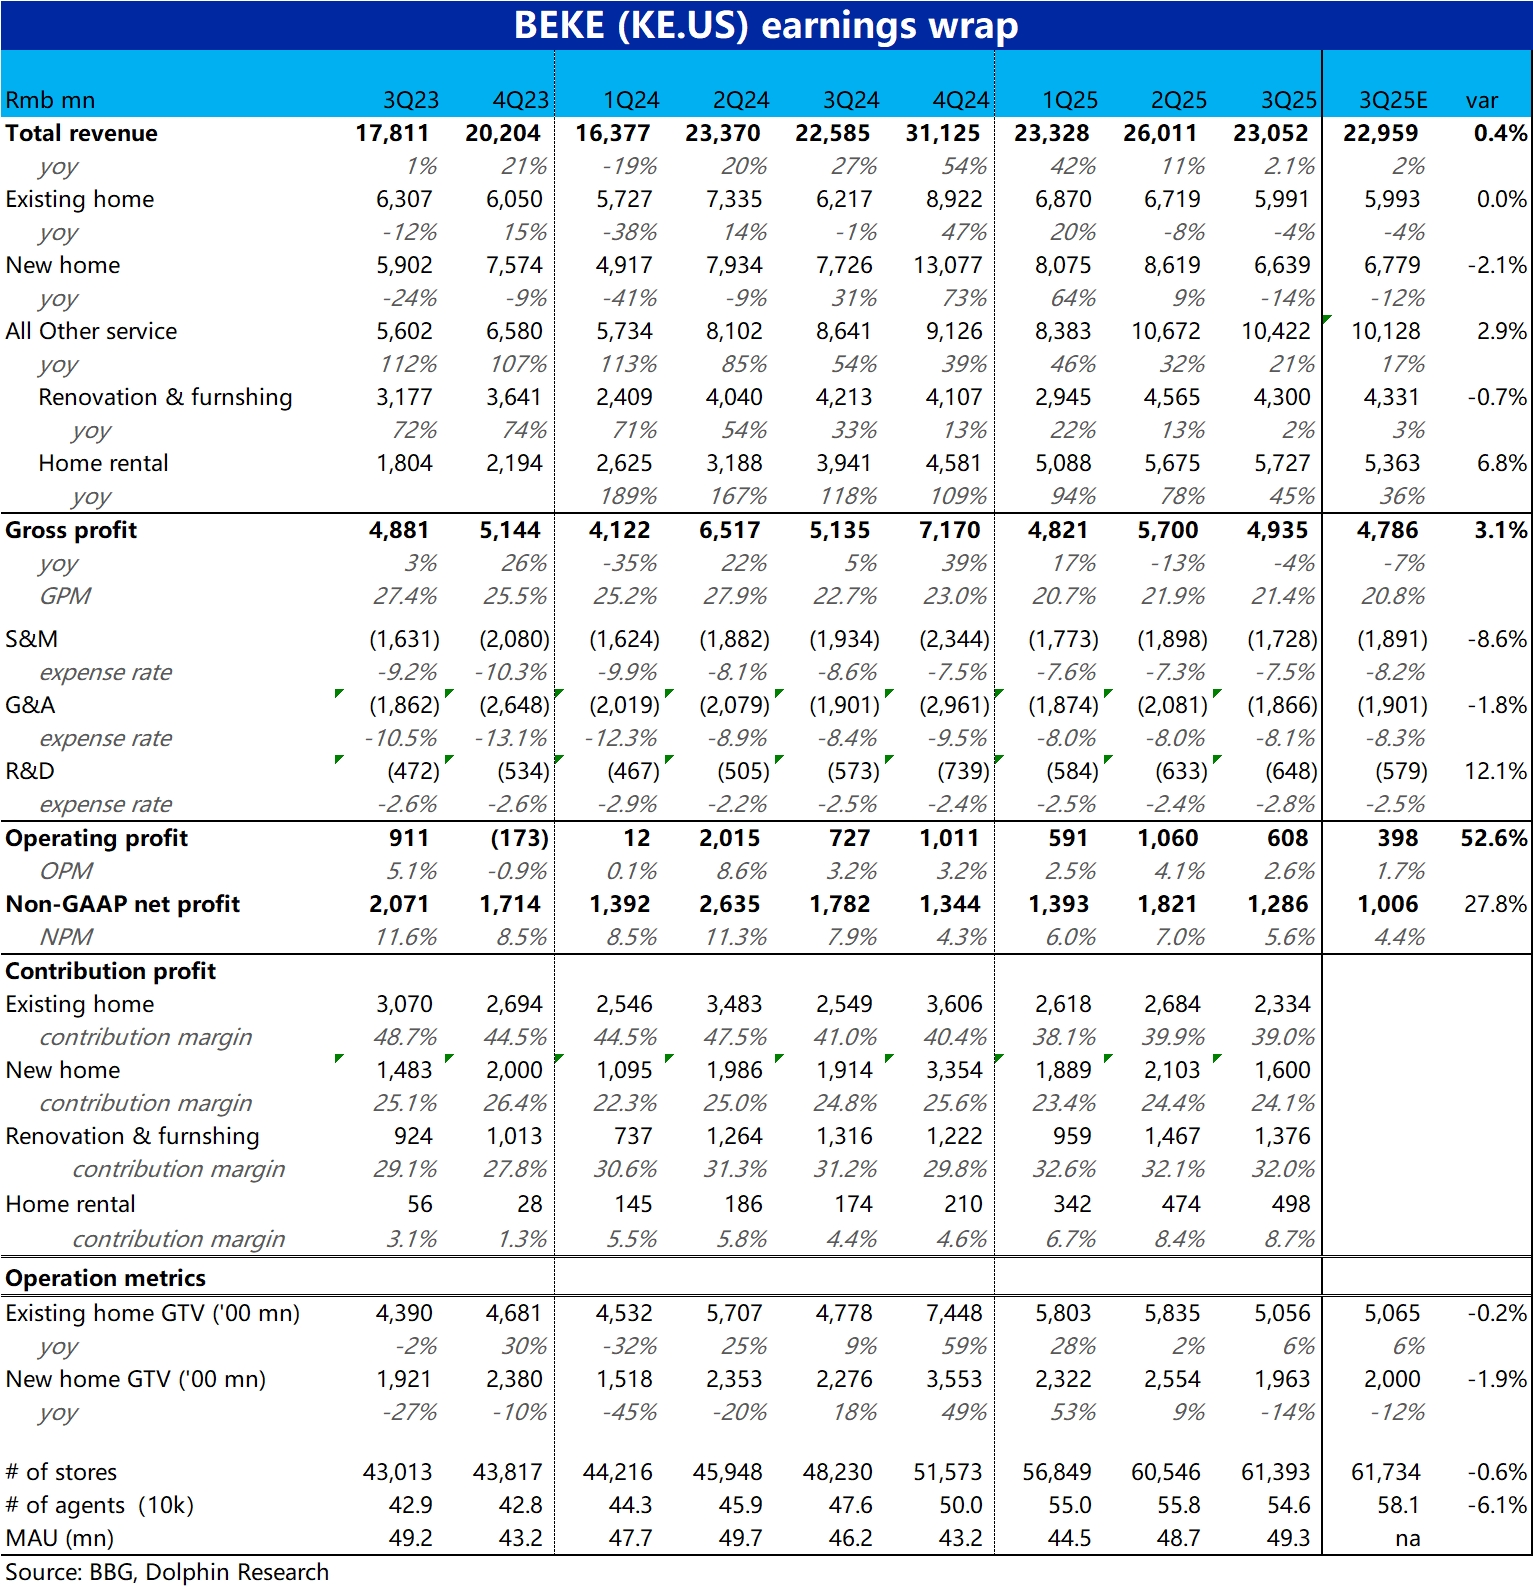
Leading domestic housing intermediary--$KE(BEKE.US) announced its Q3 2025 results on the evening of November 10th before the US stock market opened. Overall, the performance can be summarized as "not ...

 +6
+6
Beike 3Q25 Quick Interpretation: Overall, Beike's performance this quarter can be summarized as "not good, but not as bad as feared."
Due to the recent general decline in U.S. stocks, the company's sh...
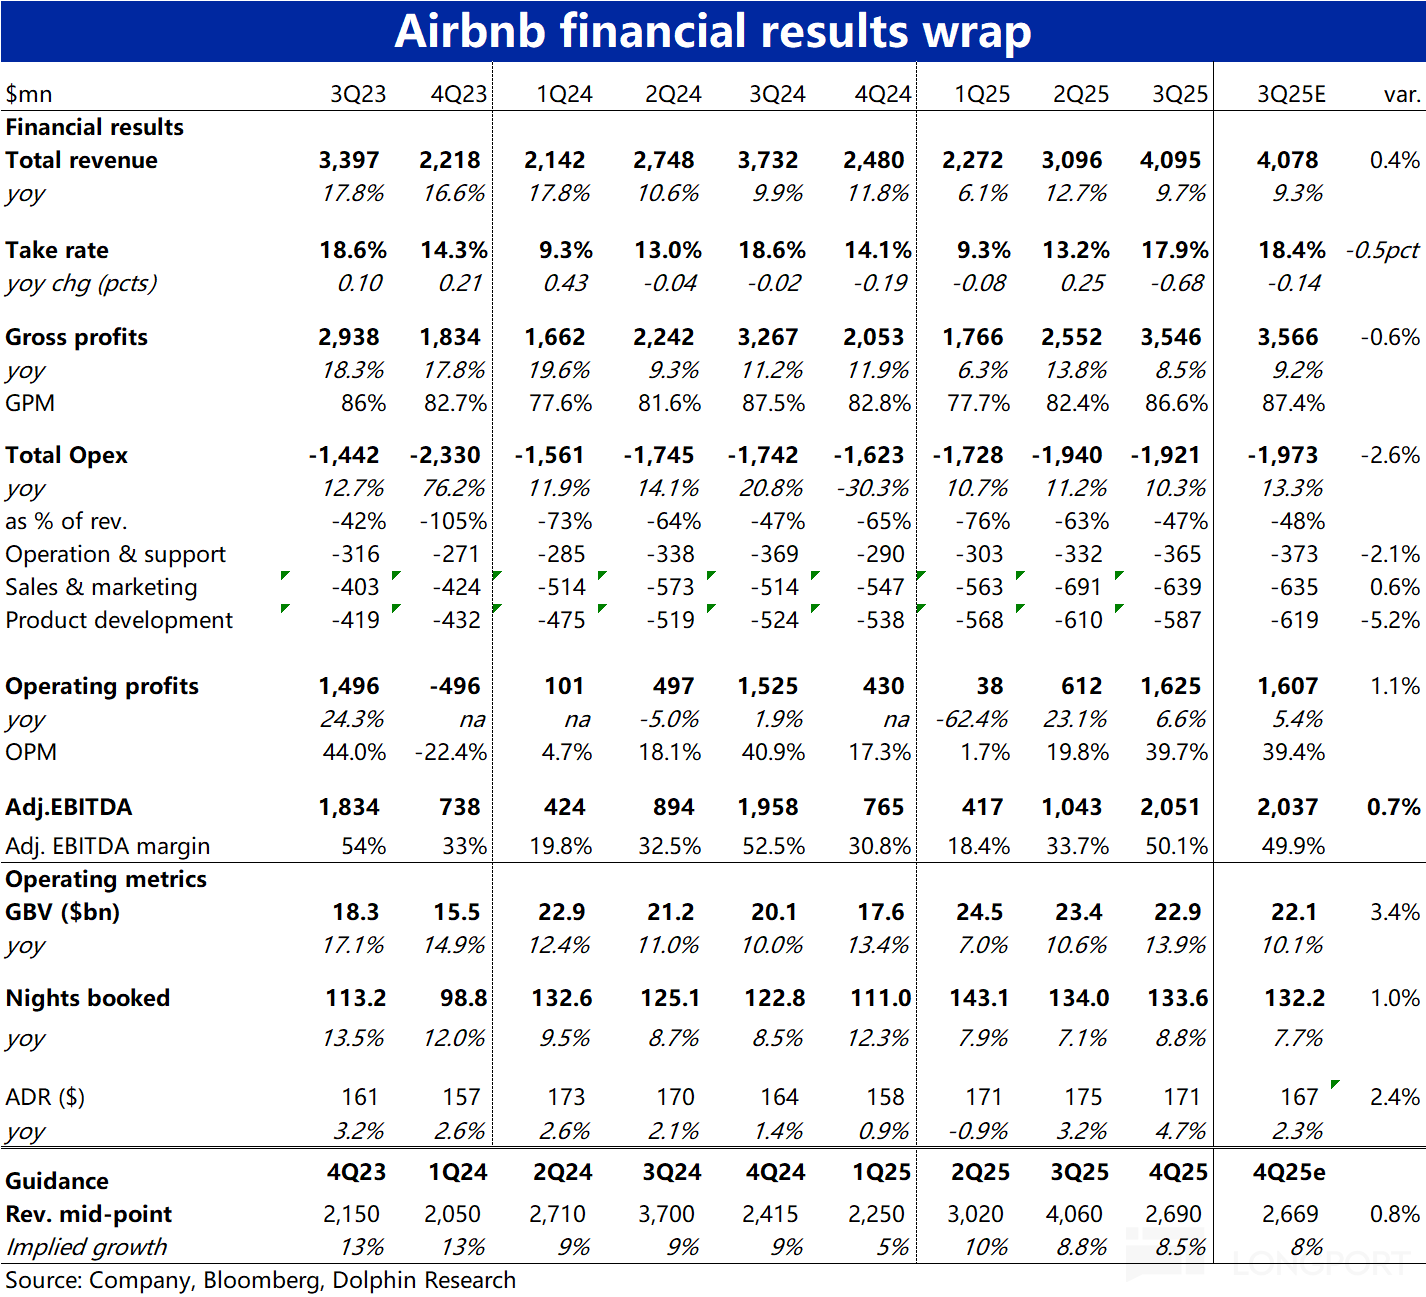
Alternative accommodation leader Airbnb$Airbnb(ABNB.US), on November 7th, after the U.S. stock market closed, announced its financial results for the third quarter of fiscal year 2025. Overall, althou...

+6