New Oriental (Minutes): Continue High Dividends and High Buybacks Next Year
The following is compiled by Dolphin Research regarding$New Oriental EDU & Tech(EDU.US) FY26 Q1 Earnings Call Minutes. For earnings interpretation, please refer to "Guidance Stabilized, Returns Maximized, Can New Oriental's Faith Be Restored?"
I. Review of Core Financial Data
1. Overall Revenue and Profit
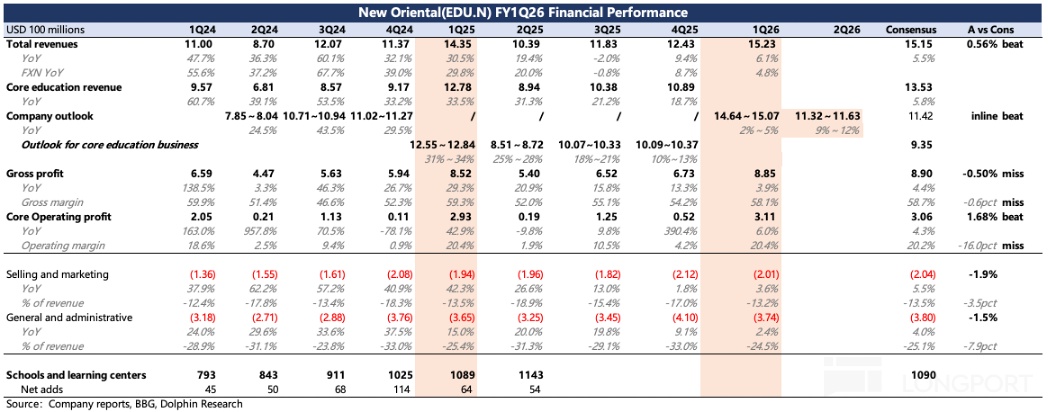
Net Revenue: Increased by 6.1% year-on-year.
Operating Revenue: Reached $310.8 million, up 6% year-on-year.
Non-GAAP Operating Revenue (excluding stock-based compensation and amortization of intangible assets from business acquisitions): Reached $335.5 million, up 11.3% year-on-year.
Net Profit Attributable: $240.7 million, down 1.9% year-on-year.
Non-GAAP Net Profit Attributable: $258.3 million, down 1.6% year-on-year.
2. Earnings Per Share
Basic and Diluted Net Profit per American Depositary Share (ADS): $1.52 and $1.50 respectively.
Non-GAAP Basic and Diluted Net Profit per ADS: $1.63 and $1.61 respectively.
3. Costs and Expenses
Operating Costs and Expenses: $1.2122 billion, up 6.1% year-on-year.
Operating Costs: $637.8 million, up 9.3% year-on-year.
Sales and Marketing Expenses: $200.6 million, up 3.6% year-on-year.
Administrative Expenses: $373.8 million, up 2.4% year-on-year.
Stock-based Compensation Expenses: Total increased by 39.8% to $23.3 million.
4. Cash Flow and Balance Sheet (as of August 31, 2025)
Net Cash Flow from Operating Activities: Approximately $192.3 million.
Capital Expenditure: $55.4 million.
Cash and Cash Equivalents: $1.2823 billion.
Term Deposits: $1.5702 billion.
Short-term Investments: $2.1781 billion.
Deferred Revenue (i.e., customer prepayments): $1.9067 billion, up 10% from $1.7331 billion at the end of FY25 Q1, reflecting an increase in customer prepayments.
5. Revenue Growth by Business Segment (Year-on-Year Growth)
Overseas Test Preparation Business: Approximately 1%.
Overseas Study Consulting Business: Approximately 2%.
Adult and College Student Business: 14%.
New Education Business: Approximately 15%, mainly focusing on promoting comprehensive student development, further driving the company's overall growth momentum.
II. Detailed Content of the Earnings Call
2.1 Key Information from Executive Statements
1. Strategic Direction and Business Progress:
New Oriental has gradually formed the correct strategic direction, entering a stable growth trajectory; performance exceeded expectations, benefiting from strong operational resilience, continuously improving business capabilities, and sustainable profitability.
(1) New Education Business Initiatives Focus on Promoting Comprehensive Student Development:
A) Children's business (cultivating innovation ability and comprehensive quality) covers about 60 cities, with the top ten cities contributing over 60% of revenue.
B) Intelligent learning systems and equipment business completed testing in about 60 existing cities, with the top ten cities contributing over 50% of revenue.
(2) Tourism-related Business Lines:
Domestic and international study tours and research camp projects cover 55 cities, with the top ten cities contributing over 50% of revenue.
High-end travel products for middle-aged and elderly groups cover 30 distinctive provinces in China and international destinations; the product matrix expands to cultural tours, Chinese study tours, global study tours, and camp education.
(3) OMO System Construction: Invested $28.5 million to upgrade the online-offline integrated teaching platform.
(4) Artificial Intelligence Field: Launched AI intelligent learning devices and smart learning solutions; optimized internal operational processes, improved efficiency, and provided support for the teaching team; will continue to optimize AI applications across the entire product line.
(5) Oriental Selection: Strategically invested in own-brand product portfolio around the commitment to "healthy, high-quality, cost-effective" products; the nutrition food series performed outstandingly; upgraded the Oriental Selection app and membership platform; focused on improving operational efficiency and profitability indicators.
2. Future Outlook and Performance Guidance:
Confident in improving profit margins and operational efficiency; implementing effective cost control to ensure sustainable profitability.
Cautiously advancing capacity expansion and business layout, focusing on cities with strong revenue and profit performance last year; closely monitoring the pace and scale of new store openings throughout the year to ensure alignment with market demand and financial performance.
Performance Guidance:
FY26 Q2 (September 1, 2025, to November 30, 2025): Expected net revenue of $1.1321 billion to $1.2633 billion, up 9% to 12% year-on-year. FY26 Full Year: Group total net revenue (including Oriental Selection business) guidance of $5.2453 billion to $5.3903 billion, up 5% to 10% year-on-year.
K-12 business revenue growth will significantly accelerate, benefiting from improved service quality, driving student retention rate improvement.
3. Shareholder Return Plan:
Ordinary Share Cash Dividend: $0.12 cash dividend per ordinary share ($1.2 per ADS), paid in two installments, totaling approximately $190 million.
First Dividend: $0.06 per ordinary share ($0.6 per ADS), paid on November 18, 2025.
Second Dividend: $0.06 per ordinary share ($0.6 per ADS), expected to be paid approximately six months after the record date is determined by the board.
Stock Repurchase Plan: Repurchase up to $300 million of ADS or ordinary shares within the next 12 months.
2.2 Q&A Session
Q: Regarding the K-12 business, I understand there were concerns about increased competition in the market, especially during the summer. Can management elaborate on the latest competitive landscape you are experiencing? Has your company made any strategic adjustments? Additionally, how should we define the reasonable level of sustainable growth for your K-12 business in the medium to long term?
A:We are pleased to see accelerated revenue growth in the K-12 business since the second quarter, mainly due to the company's efforts to improve product and service quality starting from the first quarter. Better services effectively boosted student retention rates after the summer, not only encouraging more students to choose second-quarter courses but also attracting new students through positive word-of-mouth.
Although facing pressure from competitors offering low-cost or even free courses during the summer, it is gratifying to see students returning to New Oriental in the fall. Based on this, we have raised the K-12 business guidance: Expecting approximately 20% year-on-year revenue growth for K-9 business in the second quarter, with high school business growth returning to double digits.
We believe high student retention rates and continuously improving reputation will drive revenue growth to accelerate from the second quarter and throughout the year. In the medium to long term, K-9 business will maintain over 20% year-on-year growth in 2022 and 2026, with high school business maintaining double-digit growth. This confirms that our strategy of driving sustained growth by improving student retention rates across all grade levels is correct.
Q: Regarding SBC, its performance surged 20% this quarter, reaching $23 million. What are the factors driving this growth, and what is the future trend? Can you elaborate on the driving factors behind this growth?
A:The increase in stock-based compensation expenses (SBC) this quarter mainly stems from the three-year stock-based compensation granted to management, employees, and teachers in the second half of the previous fiscal year. This grant led to a year-on-year increase in SBC expenses this quarter. Looking ahead, SBC expenses are expected to remain around this quarter's level in the coming quarters. It should be noted that such expenses are typically higher in the first year of executing the grant plan, followed by gradual reductions in the second and third years.
Q: Overseas business performance seems stronger than your earlier expectations. Can you please break down the growth of the test business by age group, and the growth composition of the consulting business by sub-segment? How should we view the sustainable growth of overseas business, and will this affect your full-year performance guidance?
A:Overseas business has indeed been affected by adverse external environments. Last quarter, we expected a 5% decline in first-quarter overseas-related business revenue, but actual performance exceeded expectations: overseas test preparation business grew by 1%, and overseas consulting business grew by 2%. We will strive to minimize future negative impacts.
For the second quarter, we still conservatively predict a low single-digit decline in overseas-related business revenue. Despite uncertainties in external environments such as international relations, we will continue to mitigate their impact. In fact, we maintain a conservative attitude towards full-year performance guidance, but expect actual performance to exceed current guidance.
Q: If your test tutoring business is performing well, then by age group, such as younger groups, high school students, and college students, which category is performing better than expected? Additionally, regarding the consulting business, I remember 60% is pure consulting services, and 40% is background enhancement business. Which part is performing better than expected?
A:In the overseas test preparation business, the younger student segment is growing very rapidly, with a year-on-year increase of over 25%, partially offsetting the decline in adult and college student business. In the overseas consulting business, non-English-speaking regions, especially consulting and background enhancement business in Asian countries, maintained rapid growth. Although the overall performance guidance for overseas test preparation and consulting business remains a year-on-year decline of about 4%-5%, we believe actual performance will exceed guidance levels.
Q: Regarding shareholder return policy, how should we view future policies? Is this based on budgeted net profit and payout ratio, or based on cash flow expectations? According to my estimates, this dividend and repurchase combined account for about 100% of GAAP net profit, does this represent the future payout ratio? Or should repurchase be seen as a one-time action limited to this year due to low stock prices?
A:The board has approved a three-year shareholder return plan. The announced $190 million dividend accounts for about 50% of last year's net profit, plus $300 million new stock repurchase, this year's capital allocation relative to last year's net profit payout ratio exceeds 130%, with dividend plus repurchase yield exceeding 5%.
Future dividends will be regular payments, and the $300 million repurchase is not a one-time arrangement. Next year, I will push the board to approve a new capital allocation plan, continuing to maintain high payout ratio and high yield. The company accumulates cash while achieving over 10% revenue growth, and the board supports more capital distribution to investors. According to the three-year shareholder return plan, we will make more distributions next year.
Q: Regarding the confirmation of the dividend calculation basis, the announcement states this is for FY26 dividends, but does this mean the actual distribution is based on FY25 earnings? Should we understand future dividend policies as being based on previous fiscal year earnings, with a one-year delay?
A:This is our internal policy, we always calculate based on the previous fiscal year's net profit. This dividend is based on last year's net profit. Next year, we will execute the same policy based on FY26 net profit.
Q: Due to the relatively high operating profit margin in the first quarter, I'm not sure if this is mainly due to cost reduction plans or other reasons? How should we expect the contribution of cost reduction plans to next quarter or full-year performance? And what is our expectation for full-year operating profit margin?
A:First-quarter group profit margin expanded by 100 basis points, mainly driven by the following factors: improved capacity utilization, optimized operational leverage, effective cost control measures, and profit contribution from Oriental Selection business. The cost control measures initiated by the company last March have shown results, and are expected to continue driving profit margin expansion during the remaining period of this fiscal year.
Optimistic about second-quarter profit margin outlook, expecting group overall profit margin expansion to exceed first quarter. Core business and Oriental Selection business profit margins are both expected to grow in the second quarter. For the full year, the group is focusing on improving profitability across all business lines, and through comprehensive cost control, expects to achieve profit margin expansion for the year.
Q: Because I noticed the relatively high tax rate in the first quarter. Can you please explain how we should view the tax rate for the next quarter and the full year?
A:The first-quarter effective tax rate rose to 27% due to special circumstances, mainly due to withholding tax impact from dividend payments in the second half of last year and early this quarter. The company's usual effective tax rate is 25%. Looking ahead, more dividends are expected to be paid to the listed company through MUFI this year, so the full-year effective tax rate will be higher than normal. This is mainly due to the company's announcement today of approximately $490 million capital distribution to investors, requiring more funding arrangements, thereby pushing up the effective tax rate.
Q: Regarding the K-9 new business, there is a significant gap in enrollment growth between tutoring business and intelligent learning systems and equipment this quarter (K-9 offline enrollment grew 15% year-on-year, below expectations. But learning equipment users grew 54% year-on-year). Is learning equipment starting to replace offline courses? To what extent is the slowdown in K-9 growth due to a larger base?
A:In fact, this year's non-subject tutoring business enrollment growth is somewhat affected by different quarter deadlines. Additionally, last year some enrollments were divided into spring and fall quarters, while this year some cities merged into one enrollment. Therefore, if compared to revenue growth, enrollment growth is relatively slow, which is one of the reasons. Middle school learning business growth is also very rapid, with user numbers significantly increasing compared to last year.
Next year, we still believe K-9 business, mainly including primary school non-subject tutoring and middle school learning business, will continue to drive overall growth, becoming the fastest-growing category.
Middle school business revenue growth is indeed slightly faster than primary school business, mainly due to two reasons: one is its relatively low business base; the other is that we have invested a lot of resources and effort in developing middle school business over the past three to four years. The team has provided better products, welcomed by students, thereby driving revenue growth.
Looking ahead, we believe middle school business revenue growth will continue to be slightly higher than K-10 business. Overall, K-9 new business growth trend is clear, as shown in our guidance for the second quarter and the full year, revenue acceleration has arrived. The second quarter K-9 business is expected to achieve approximately 20% revenue growth, and we look forward to better performance in the second half, expecting K-9 business to achieve over 35% year-on-year growth in the fourth quarter.
Q: Regarding next fiscal year's growth guidance?
A: I think it is reasonable to estimate revenue growth for all core business lines for the next fiscal year based on fourth-quarter growth. As we said, pressure certainly comes from overseas study-related business, but we believe this business will stabilize. Based on current estimates, single-digit growth is acceptable to us, which is already a conservative estimate.
For new business, K-9 new business growth should be around 25%, possibly 25% to 30%. High-end business growth may come from middle school and elementary school groups, as the base is high, our revenue scale has exceeded pre-policy adjustment levels. This growth level is considered sustainable and healthy.
High school business conservative estimate may continue to maintain 12% to 13% growth. Tourism business conservative estimate may grow 15% to 20% next year. Above is the situation for all core business lines
<End Here>
Risk Disclosure and Statement of this Article:Dolphin Research Disclaimer and General Disclosure
