Search...
Company Encyclopedia
View More

InnoCare Pharma
688428.SH
InnoCare Pharma Limited, a biopharmaceutical company, engages in discovering, developing, and commercializing drugs for the treatment of cancer and autoimmune diseases in China. The company develops Orelabrutinib, an BTK inhibitor to treat patients with relapsed and/or refractory (r/r) chronic lymphocytic leukemia, r/r mantle cell lymphoma, r/r Waldenstrom’s macroglobulinemia, r/r marginal zone lymphoma, r/r diffuse large B-cell lymphoma (DLBCL)- MCD, r/r central nervous system lymphoma, combo w/MIL-62, systemic lupus erythematosus, immune thrombocytopenia purpura, multiple sclerosis, and neuromyelitis optica spectrum disorder. It also developing ICP-192, a pan-FGFR inhibitor that is in a registrational trial for the treatment of solid tumor patients, including cholangiocarcinoma; ICP-723, a pan-TRK inhibitor, which is in Phase I clinical trial to treat neurotrophic tyrosine receptor kinase fusion positive cancers; ICP-332, a novel tyrosine kinase 2 inhibitor that is in a Phase II clinical trial for the treatment of autoimmune diseases; and ICP-B02, a bispecific antibody for the treatment of lymphoma. In addition, the company develops ICP-189 and ICP-B03 for the treatment of solid tumors; ICP-033 to treat liver cancer, renal cell carcinoma, colorectal cancer, and other solid tumors; ICP-488 for the treatment of autoimmune diseases; ICP-B05, an anti-CC chemokine receptor 8 monoclonal antibody for the treatment of various cancers; ICP-248 to treat hematology; and ICP-490 for the treatment of hematology and autoimmune diseases.
1.617 T
688428.SHMarket value -Rank by Market Cap -/-
Valuation analysis

P/E
1Y
3Y
5Y
10Y
P/E
-
Industry Ranking
-/-
- P/E
- Price
- High
- Median
- Low
P/B
1Y
3Y
5Y
10Y
P/B
-
Industry Ranking
-/-
- P/B
- Price
- High
- Median
- Low
P/S
1Y
3Y
5Y
10Y
P/S
-
Industry Ranking
-/-
- P/S
- Price
- High
- Median
- Low
Dividend Yield
1Y
3Y
5Y
10Y
Dividend Yield
-
Industry Ranking
-/-
- Dividend Yield
- Price
- High
- Median
- Low
Institutional View & Shareholder
Analyst Ratings
- Price--
- Highest--
- Lowest--
News
View More
Posts
View More
Hot Trades in Hong Kong Stocks (8.14) | Hang Seng Index Hits Four-Year High at Opening, Morgan Stanley Says Foreign Capital Accelerated Inflows into Chinese Stock Market in July
The Hang Seng Index opened higher, refreshing its nearly four-year high; Tencent's performance exceeded expectations, receiving collective bullish calls from major banks; Chip stocks strengthened on t...
Hot Trades in Hong Kong Stocks (8.7)| Chip Stocks Rebound Strongly, Apple Supply Chain Follows; Xiaomi and Pharmaceuticals Retreat Under Pressure
Hot trading industry trends on August 7 and related Hong Kong semiconductor stocks. Hong Kong semiconductor stocks opened lower in early trading but then surged strongly, with Innoscience gaining over...
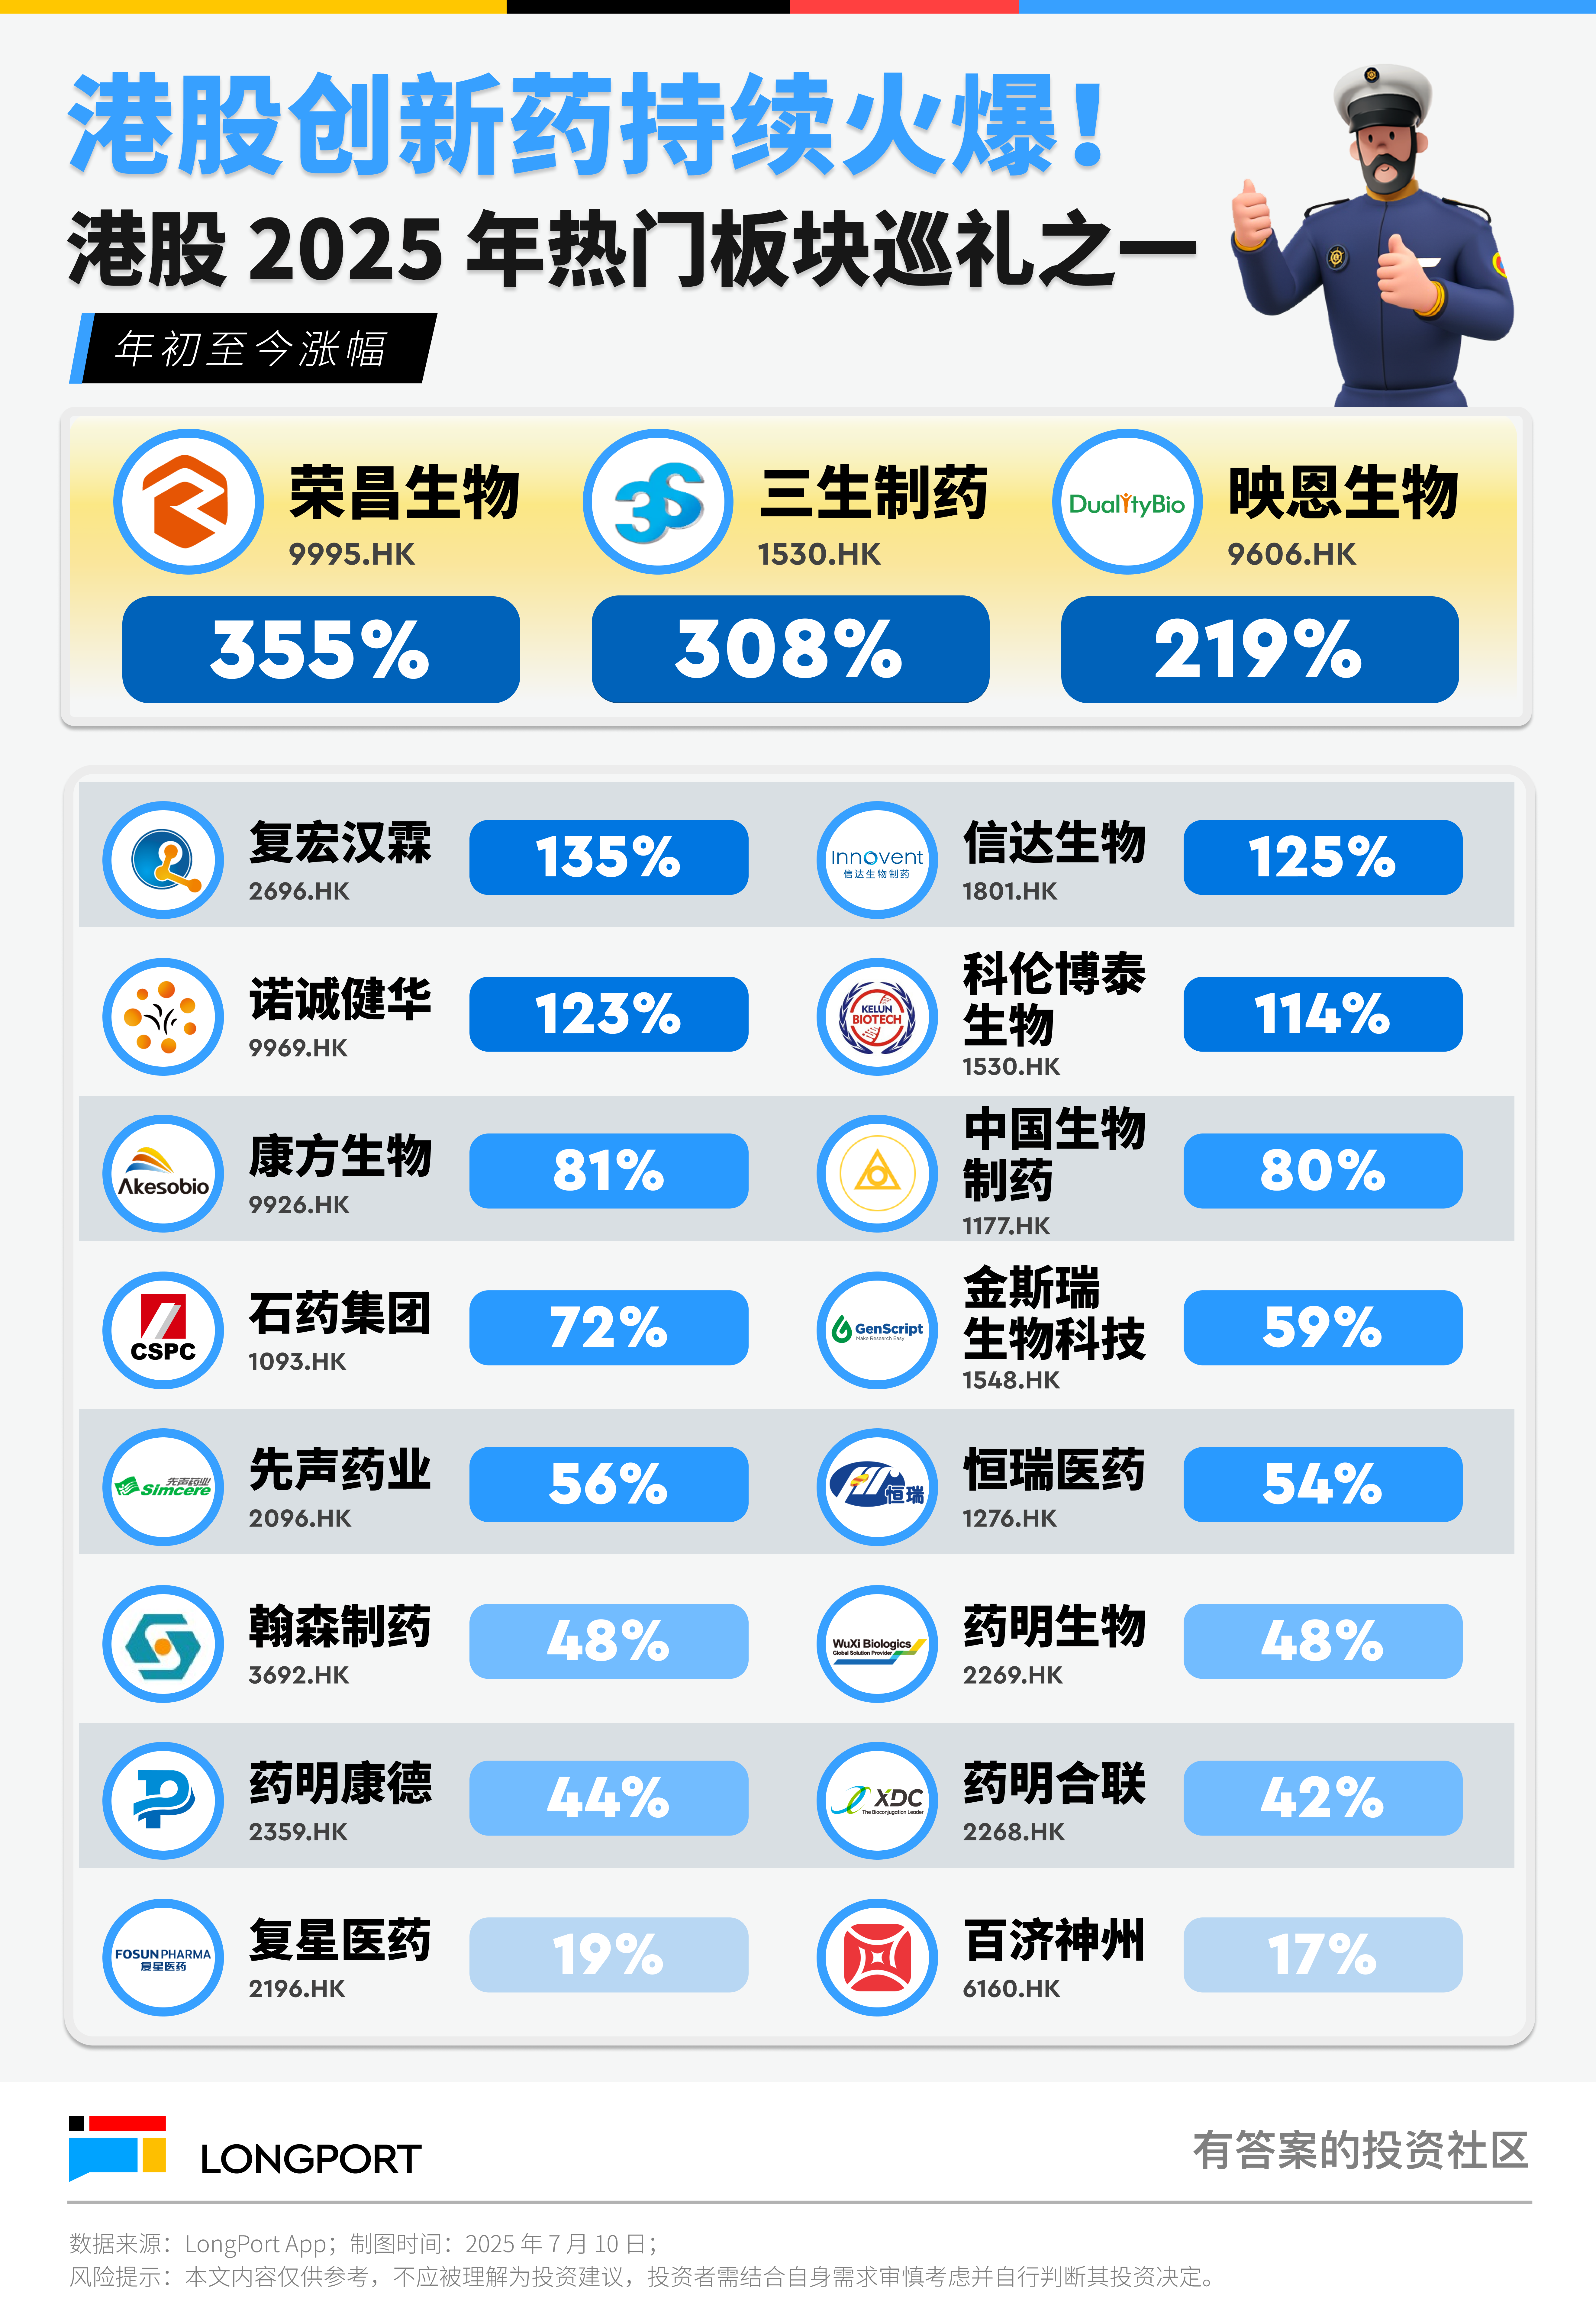
Hong Kong stocks' innovative drugs surge 66%! Three major catalysts ignite the 'golden track', can we still get on board in the second half of the year?
Hong Kong stocks' innovative medicine sector surges 66%, three-pronged approach ignites the golden track